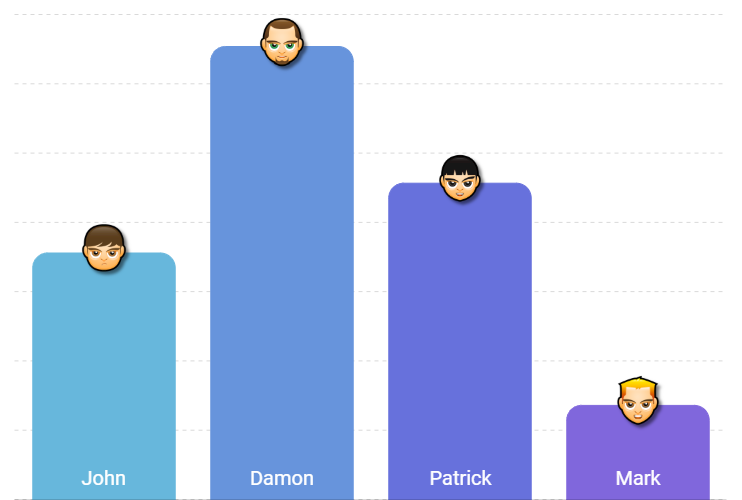
Column chart with images on top
Demo source
JavaScript TypeScript / ES6 ...
<style >
#chartdiv {
width : 100% ;
height : 500px ;
}
</style >
<script src ="https://cdn.amcharts.com/lib/4/core.js" > </script >
<script src ="https://cdn.amcharts.com/lib/4/charts.js" > </script >
<script src ="https://cdn.amcharts.com/lib/4/themes/animated.js" > </script >
<script >
am4core.ready (function (useTheme (am4themes_animated);
var chart = am4core.create ("chartdiv" , am4charts.XYChart );
chart.data = [{
"name" : "John" ,
"points" : 35654 ,
"color" : chart.colors .next (),
"bullet" : "https://www.amcharts.com/lib/images/faces/A04.png"
}, {
"name" : "Damon" ,
"points" : 65456 ,
"color" : chart.colors .next (),
"bullet" : "https://www.amcharts.com/lib/images/faces/C02.png"
}, {
"name" : "Patrick" ,
"points" : 45724 ,
"color" : chart.colors .next (),
"bullet" : "https://www.amcharts.com/lib/images/faces/D02.png"
}, {
"name" : "Mark" ,
"points" : 13654 ,
"color" : chart.colors .next (),
"bullet" : "https://www.amcharts.com/lib/images/faces/E01.png"
}];
var categoryAxis = chart.xAxes .push (new am4charts.CategoryAxis ());
categoryAxis.dataFields .category = "name" ;
categoryAxis.renderer .grid .template .disabled = true ;
categoryAxis.renderer .minGridDistance = 30 ;
categoryAxis.renderer .inside = true ;
categoryAxis.renderer .labels .template .fill = am4core.color ("#fff" );
categoryAxis.renderer .labels .template .fontSize = 20 ;
var valueAxis = chart.yAxes .push (new am4charts.ValueAxis ());
valueAxis.renderer .grid .template .strokeDasharray = "4,4" ;
valueAxis.renderer .labels .template .disabled = true ;
valueAxis.min = 0 ;
chart.maskBullets = false ;
chart.paddingBottom = 0 ;
var series = chart.series .push (new am4charts.ColumnSeries ());
series.dataFields .valueY = "points" ;
series.dataFields .categoryX = "name" ;
series.columns .template .propertyFields .fill = "color" ;
series.columns .template .propertyFields .stroke = "color" ;
series.columns .template .column .cornerRadiusTopLeft = 15 ;
series.columns .template .column .cornerRadiusTopRight = 15 ;
series.columns .template .tooltipText = "{categoryX}: [bold]{valueY}[/b]" ;
var bullet = series.bullets .push (new am4charts.Bullet ());
var image = bullet.createChild (am4core.Image );
image.horizontalCenter = "middle" ;
image.verticalCenter = "bottom" ;
image.dy = 20 ;
image.y = am4core.percent (100 );
image.propertyFields .href = "bullet" ;
image.tooltipText = series.columns .template .tooltipText ;
image.propertyFields .fill = "color" ;
image.filters .push (new am4core.DropShadowFilter ());
});
</script >
<div id ="chartdiv" > </div >
import * as am4core from "@amcharts/amcharts4/core" ;
import * as am4charts from "@amcharts/amcharts4/charts" ;
import am4themes_animated from "@amcharts/amcharts4/themes/animated" ;
am4core.useTheme (am4themes_animated);
let chart = am4core.create ("chartdiv" , am4charts.XYChart );
chart.data = [{
"name" : "John" ,
"points" : 35654 ,
"color" : chart.colors .next (),
"bullet" : "https://www.amcharts.com/lib/images/faces/A04.png"
}, {
"name" : "Damon" ,
"points" : 65456 ,
"color" : chart.colors .next (),
"bullet" : "https://www.amcharts.com/lib/images/faces/C02.png"
}, {
"name" : "Patrick" ,
"points" : 45724 ,
"color" : chart.colors .next (),
"bullet" : "https://www.amcharts.com/lib/images/faces/D02.png"
}, {
"name" : "Mark" ,
"points" : 13654 ,
"color" : chart.colors .next (),
"bullet" : "https://www.amcharts.com/lib/images/faces/E01.png"
}];
let categoryAxis = chart.xAxes .push (new am4charts.CategoryAxis ());
categoryAxis.dataFields .category = "name" ;
categoryAxis.renderer .grid .template .disabled = true ;
categoryAxis.renderer .minGridDistance = 30 ;
categoryAxis.renderer .inside = true ;
categoryAxis.renderer .labels .template .fill = am4core.color ("#fff" );
categoryAxis.renderer .labels .template .fontSize = 20 ;
let valueAxis = chart.yAxes .push (new am4charts.ValueAxis ());
valueAxis.renderer .grid .template .strokeDasharray = "4,4" ;
valueAxis.renderer .labels .template .disabled = true ;
valueAxis.min = 0 ;
chart.maskBullets = false ;
chart.paddingBottom = 0 ;
let series = chart.series .push (new am4charts.ColumnSeries ());
series.dataFields .valueY = "points" ;
series.dataFields .categoryX = "name" ;
series.columns .template .propertyFields .fill = "color" ;
series.columns .template .propertyFields .stroke = "color" ;
series.columns .template .column .cornerRadiusTopLeft = 15 ;
series.columns .template .column .cornerRadiusTopRight = 15 ;
series.columns .template .tooltipText = "{categoryX}: [bold]{valueY}[/b]" ;
let bullet = series.bullets .push (new am4charts.Bullet ());
let image = bullet.createChild (am4core.Image );
image.horizontalCenter = "middle" ;
image.verticalCenter = "bottom" ;
image.dy = 20 ;
image.y = am4core.percent (100 );
image.propertyFields .href = "bullet" ;
image.tooltipText = series.columns .template .tooltipText ;
image.propertyFields .fill = "color" ;
image.filters .push (new am4core.DropShadowFilter ());