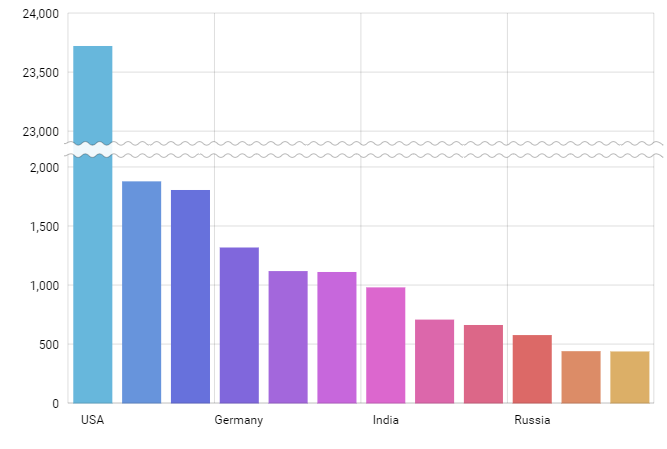
Column chart with axis break
Axis breaks
Axis breaks allows shrinking part of the axis scale. Hover the break to expand and see actual scale.
Demo source
<!-- Styles -->
<style>
#chartdiv {
  width: 100%;
  height: 500px;
}
</style>

<!-- Resources -->
<script src="https://cdn.amcharts.com/lib/4/core.js"></script>
<script src="https://cdn.amcharts.com/lib/4/charts.js"></script>
<script src="https://cdn.amcharts.com/lib/4/themes/animated.js"></script>

<!-- Chart code -->
<script>
am4core.ready(function() {

// Themes begin
am4core.useTheme(am4themes_animated);
// Themes end

var chart = am4core.create("chartdiv", am4charts.XYChart);
chart.hiddenState.properties.opacity = 0; // this creates initial fade-in

chart.data = [
  {
    country: "USA",
    visits: 23725
  },
  {
    country: "China",
    visits: 1882
  },
  {
    country: "Japan",
    visits: 1809
  },
  {
    country: "Germany",
    visits: 1322
  },
  {
    country: "UK",
    visits: 1122
  },
  {
    country: "France",
    visits: 1114
  },
  {
    country: "India",
    visits: 984
  },
  {
    country: "Spain",
    visits: 711
  },
  {
    country: "Netherlands",
    visits: 665
  },
  {
    country: "Russia",
    visits: 580
  },
  {
    country: "South Korea",
    visits: 443
  },
  {
    country: "Canada",
    visits: 441
  }
];

var categoryAxis = chart.xAxes.push(new am4charts.CategoryAxis());
categoryAxis.renderer.grid.template.location = 0;
categoryAxis.dataFields.category = "country";
categoryAxis.renderer.minGridDistance = 40;
categoryAxis.fontSize = 11;

var valueAxis = chart.yAxes.push(new am4charts.ValueAxis());
valueAxis.min = 0;
valueAxis.max = 24000;
valueAxis.strictMinMax = true;
valueAxis.renderer.minGridDistance = 30;
// axis break
var axisBreak = valueAxis.axisBreaks.create();
axisBreak.startValue = 2100;
axisBreak.endValue = 22900;
//axisBreak.breakSize = 0.005;

// fixed axis break
var d = (axisBreak.endValue - axisBreak.startValue) / (valueAxis.max - valueAxis.min);
axisBreak.breakSize = 0.05 * (1 - d) / d; // 0.05 means that the break will take 5% of the total value axis height

// make break expand on hover
var hoverState = axisBreak.states.create("hover");
hoverState.properties.breakSize = 1;
hoverState.properties.opacity = 0.1;
hoverState.transitionDuration = 1500;

axisBreak.defaultState.transitionDuration = 1000;
/*
// this is exactly the same, but with events
axisBreak.events.on("over", function() {
  axisBreak.animate(
    [{ property: "breakSize", to: 1 }, { property: "opacity", to: 0.1 }],
    1500,
    am4core.ease.sinOut
  );
});
axisBreak.events.on("out", function() {
  axisBreak.animate(
    [{ property: "breakSize", to: 0.005 }, { property: "opacity", to: 1 }],
    1000,
    am4core.ease.quadOut
  );
});*/

var series = chart.series.push(new am4charts.ColumnSeries());
series.dataFields.categoryX = "country";
series.dataFields.valueY = "visits";
series.columns.template.tooltipText = "{valueY.value}";
series.columns.template.tooltipY = 0;
series.columns.template.strokeOpacity = 0;

// as by default columns of the same series are of the same color, we add adapter which takes colors from chart.colors color set
series.columns.template.adapter.add("fill", function(fill, target) {
  return chart.colors.getIndex(target.dataItem.index);
});

}); // end am4core.ready()
</script>

<!-- HTML -->
<div id="chartdiv"></div>