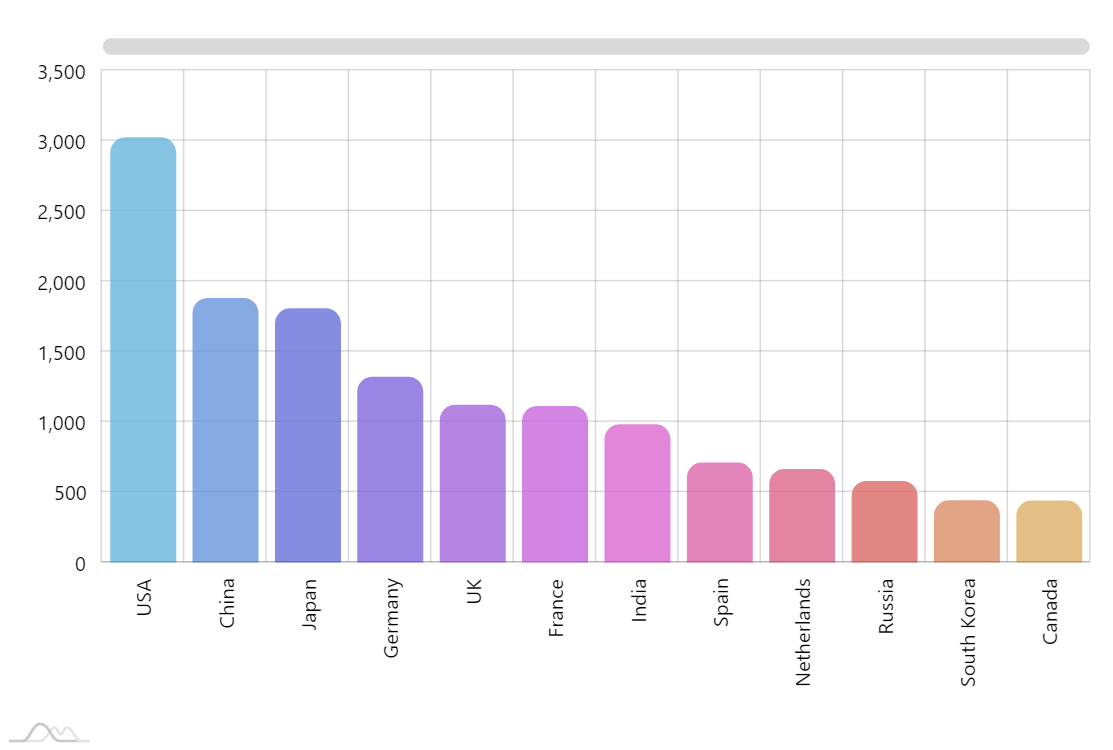
Column With Rotated Series
Column chart (or Bar chart) is the most recognizable and easiest to comprehend chart type. When your goal is not to woo viewers with fancy graphics but rather delivering the information in the most straightforward way, Column chart is your best friend. However, when you get over a certain amount of columns (or your items just have fairly long names) axis labels become quite crowded and hard to read.
One option to rectify this is to switch from a vertical to a horizontal bar chart.
Another quick fix is to turn the labels on their side. In amCharts 4 you do this with the Label.rotation property on the axis.
categoryAxis.renderer.labels.template.rotation = 270;
Demo source
<!-- Styles -->
<style>
#chartdiv {
  width: 100%;
  height: 500px;
}
</style>

<!-- Resources -->
<script src="https://cdn.amcharts.com/lib/4/core.js"></script>
<script src="https://cdn.amcharts.com/lib/4/charts.js"></script>
<script src="https://cdn.amcharts.com/lib/4/themes/animated.js"></script>

<!-- Chart code -->
<script>
am4core.ready(function() {

// Themes begin
am4core.useTheme(am4themes_animated);
// Themes end

// Create chart instance
var chart = am4core.create("chartdiv", am4charts.XYChart);
chart.scrollbarX = new am4core.Scrollbar();

// Add data
chart.data = [{
  "country": "USA",
  "visits": 3025
}, {
  "country": "China",
  "visits": 1882
}, {
  "country": "Japan",
  "visits": 1809
}, {
  "country": "Germany",
  "visits": 1322
}, {
  "country": "UK",
  "visits": 1122
}, {
  "country": "France",
  "visits": 1114
}, {
  "country": "India",
  "visits": 984
}, {
  "country": "Spain",
  "visits": 711
}, {
  "country": "Netherlands",
  "visits": 665
}, {
  "country": "Russia",
  "visits": 580
}, {
  "country": "South Korea",
  "visits": 443
}, {
  "country": "Canada",
  "visits": 441
}];

// Create axes
var categoryAxis = chart.xAxes.push(new am4charts.CategoryAxis());
categoryAxis.dataFields.category = "country";
categoryAxis.renderer.grid.template.location = 0;
categoryAxis.renderer.minGridDistance = 30;
categoryAxis.renderer.labels.template.horizontalCenter = "right";
categoryAxis.renderer.labels.template.verticalCenter = "middle";
categoryAxis.renderer.labels.template.rotation = 270;
categoryAxis.tooltip.disabled = true;
categoryAxis.renderer.minHeight = 110;

var valueAxis = chart.yAxes.push(new am4charts.ValueAxis());
valueAxis.renderer.minWidth = 50;

// Create series
var series = chart.series.push(new am4charts.ColumnSeries());
series.sequencedInterpolation = true;
series.dataFields.valueY = "visits";
series.dataFields.categoryX = "country";
series.tooltipText = "[{categoryX}: bold]{valueY}[/]";
series.columns.template.strokeWidth = 0;

series.tooltip.pointerOrientation = "vertical";

series.columns.template.column.cornerRadiusTopLeft = 10;
series.columns.template.column.cornerRadiusTopRight = 10;
series.columns.template.column.fillOpacity = 0.8;

// on hover, make corner radiuses bigger
var hoverState = series.columns.template.column.states.create("hover");
hoverState.properties.cornerRadiusTopLeft = 0;
hoverState.properties.cornerRadiusTopRight = 0;
hoverState.properties.fillOpacity = 1;

series.columns.template.adapter.add("fill", function(fill, target) {
  return chart.colors.getIndex(target.dataItem.index);
});

// Cursor
chart.cursor = new am4charts.XYCursor();

}); // end am4core.ready()
</script>

<!-- HTML -->
<div id="chartdiv"></div> 