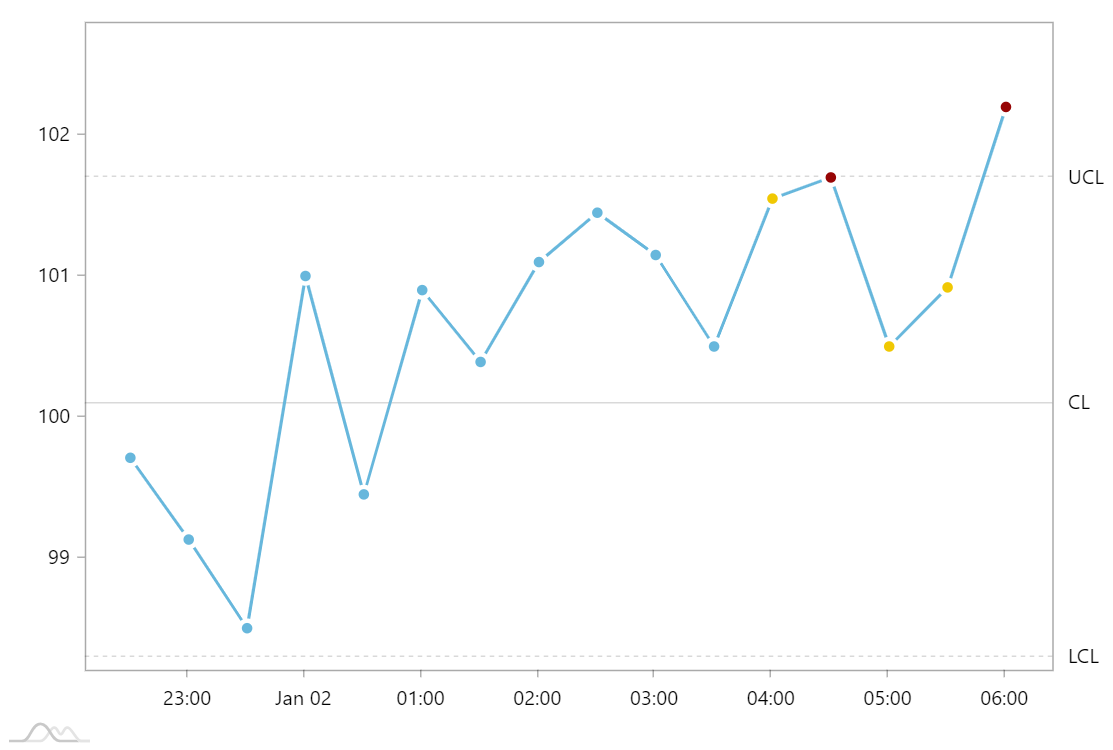
Control Chart
This demo shows how XYChart can be used to create a Control Chart (also known as Shewhart chart).
Demo source
<!-- Styles -->
<style>
#chartdiv {
  width: 100%;
  height: 500px;
}
</style>

<!-- Resources -->
<script src="https://cdn.amcharts.com/lib/4/core.js"></script>
<script src="https://cdn.amcharts.com/lib/4/charts.js"></script>
<script src="https://cdn.amcharts.com/lib/4/themes/animated.js"></script>

<!-- Chart code -->
<script>
am4core.ready(function() {

// Themes begin
am4core.useTheme(am4themes_animated);
// Themes end

// Create chart instance
var chart = am4core.create("chartdiv", am4charts.XYChart);
chart.plotContainer.stroke = am4core.color("#aaa");
chart.plotContainer.strokeOpacity = 1;
chart.paddingRight = 40;

// Add data
chart.data = [{
  "timestamp": new Date(2020, 0, 1, 22, 30),
  "value": 99.71
}, {
  "timestamp": new Date(2020, 0, 1, 23, 0),
  "value": 99.13
}, {
  "timestamp": new Date(2020, 0, 1, 23, 30),
  "value": 98.5
}, {
  "timestamp": new Date(2020, 0, 2, 0, 0),
  "value": 101
}, {
  "timestamp": new Date(2020, 0, 2, 0, 30),
  "value": 99.45
}, {
  "timestamp": new Date(2020, 0, 2, 1, 0),
  "value": 100.9
}, {
  "timestamp": new Date(2020, 0, 2, 1, 30),
  "value": 100.39
}, {
  "timestamp": new Date(2020, 0, 2, 2, 0),
  "value": 101.1
}, {
  "timestamp": new Date(2020, 0, 2, 2, 30),
  "value": 101.45
}, {
  "timestamp": new Date(2020, 0, 2, 3, 0),
  "value": 101.15
}, {
  "timestamp": new Date(2020, 0, 2, 3, 30),
  "value": 100.5
}, {
  "timestamp": new Date(2020, 0, 2, 4, 0),
  "value": 101.55,
  "color": am4core.color("#f0c803")
}, {
  "timestamp": new Date(2020, 0, 2, 4, 30),
  "value": 101.7,
  "color": am4core.color("#970505")
}, {
  "timestamp": new Date(2020, 0, 2, 5, 0),
  "value": 100.5,
  "color": am4core.color("#f0c803")
}, {
  "timestamp": new Date(2020, 0, 2, 5, 30),
  "value": 100.92,
  "color": am4core.color("#f0c803")
}, {
  "timestamp": new Date(2020, 0, 2, 6, 0),
  "value": 102.2,
  "color": am4core.color("#970505")
}];

// Create axes
var dateAxis = chart.xAxes.push(new am4charts.DateAxis());
dateAxis.renderer.grid.template.disabled = true;
dateAxis.renderer.ticks.template.disabled = false;
dateAxis.renderer.ticks.template.strokeOpacity = 0.3;
dateAxis.renderer.labels.template.location = 0.00001;
dateAxis.extraMin = 0.05;
dateAxis.extraMax = 0.05;
dateAxis.renderer.minGridDistance = 60;
dateAxis.baseInterval = {
  "timeUnit": "minute",
  "count": 1
}

var valueAxis = chart.yAxes.push(new am4charts.ValueAxis());
valueAxis.maxPrecision = 0;
valueAxis.renderer.grid.template.disabled = true;
valueAxis.renderer.ticks.template.disabled = false;
valueAxis.renderer.ticks.template.strokeOpacity = 0.3;
// valueAxis.renderer.minLabelPosition = 0.01;
// valueAxis.renderer.maxLabelPosition = 0.99;
valueAxis.min = 98.2;
valueAxis.max = 102.8;
valueAxis.strictMinMax = true;

// Create series
var series = chart.series.push(new am4charts.LineSeries());
series.dataFields.valueY = "value";
series.dataFields.dateX = "timestamp";
series.strokeWidth = 2;

// Bullets
var bullet = series.bullets.push(new am4charts.CircleBullet());
bullet.circle.stroke = am4core.color("#fff");
bullet.circle.strokeWidth = 3;
bullet.circle.propertyFields.fill = "color";

// Guides
function createGuide(value, label, dashed) {
  var range = valueAxis.axisRanges.create();
  range.value = value;
  range.label.text = label;
  range.label.inside = true;
  range.label.align = "right";
  range.label.textAlign = "start";
  range.label.adapter.add("horizontalCenter", function() {
    return "left";
  })
  range.axisFill.disabled = true;
  range.tick.disabled = true;

  if (dashed) {
    range.grid.strokeDasharray = "3,3";
  }
}

createGuide(98.3, "LCL", true);
createGuide(100.1, "CL", false);
createGuide(101.7, "UCL", true);

}); // end am4core.ready()
</script>

<!-- HTML -->
<div id="chartdiv"></div>