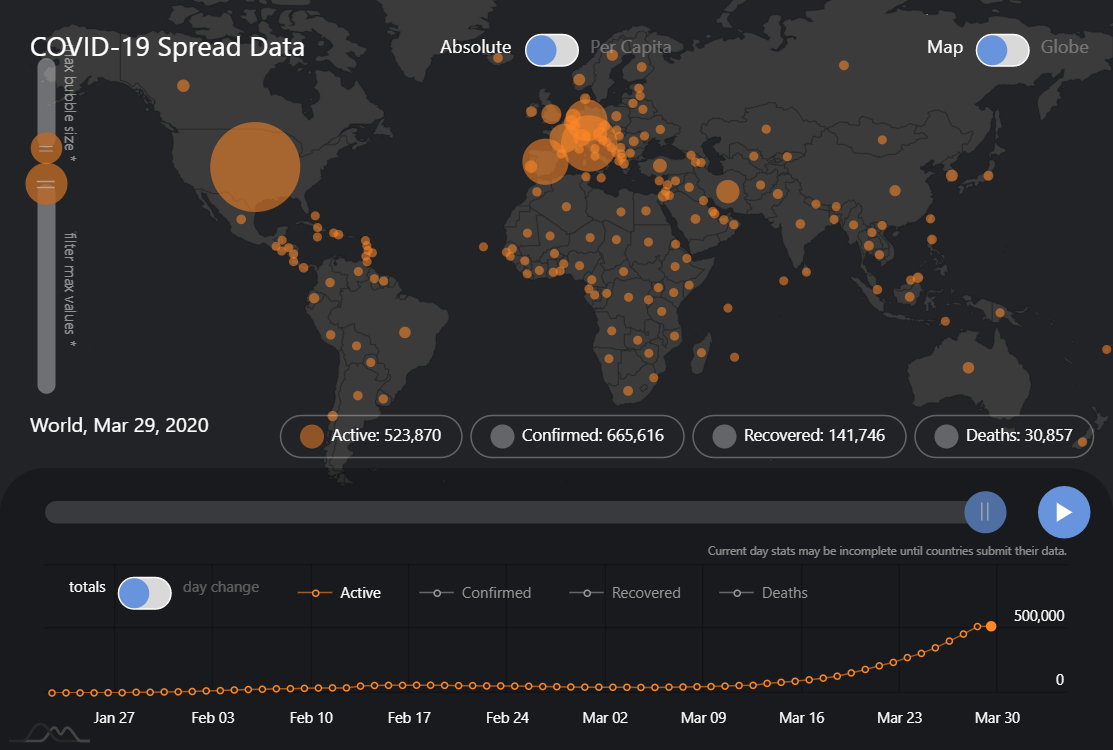
Coronavirus animated dashboard
IMPORTANT! This chart is for reference only. It uses data that is not being updated and therefore is not current.
This demo show sample dashboard to depict timeline data for COVID-19 epidemics.
Grab full source and data from GitHub
Demo source
<!-- Styles -->
<style>
#chartdiv {
max-width: 100%;
height: 800px;
background-color:#212327;
}
</style>
<!-- Resources -->
<script src="https://cdn.amcharts.com/lib/4/core.js"></script>
<script src="https://cdn.amcharts.com/lib/4/charts.js"></script>
<script src="https://cdn.amcharts.com/lib/4/maps.js"></script>
<script src="https://cdn.amcharts.com/lib/4/geodata/worldLow.js"></script>
<script src="https://covid.amcharts.com/data/js/world_timeline.js"></script>
<script src="https://covid.amcharts.com/data/js/total_timeline.js"></script>
<script src="https://cdn.amcharts.com/lib/4/themes/animated.js"></script>
<!-- Chart code -->
<script>
am4core.ready(function() {
// Themes begin
am4core.useTheme(am4themes_animated);
// Themes end
am4core.ready(function() {
var numberFormatter = new am4core.NumberFormatter();
var backgroundColor = am4core.color("#1e2128");
var activeColor = am4core.color("#ff8726");
var confirmedColor = am4core.color("#d21a1a");
var recoveredColor = am4core.color("#45d21a");
var deathsColor = am4core.color("#1c5fe5");
// for an easier access by key
var colors = { active: activeColor, confirmed: confirmedColor, recovered: recoveredColor, deaths: deathsColor };
var countryColor = am4core.color("#3b3b3b");
var countryStrokeColor = am4core.color("#000000");
var buttonStrokeColor = am4core.color("#ffffff");
var countryHoverColor = am4core.color("#1b1b1b");
var activeCountryColor = am4core.color("#0f0f0f");
var currentIndex;
var currentCountry = "World";
// last date of the data
var lastDate = new Date(covid_total_timeline[covid_total_timeline.length - 1].date);
var currentDate = lastDate;
var currentPolygon;
var countryDataTimeout;
var currentType;
var currentTypeName;
var sliderAnimation;
var perCapita = false;
//////////////////////////////////////////////////////////////////////////////
// PREPARE DATA
//////////////////////////////////////////////////////////////////////////////
// make a map of country indexes for later use
var countryIndexMap = {};
var list = covid_world_timeline[covid_world_timeline.length - 1].list;
for (var i = 0; i < list.length; i++) {
var country = list[i]
countryIndexMap[country.id] = i;
}
// calculated active cases in world data (active = confirmed - recovered)
for (var i = 0; i < covid_total_timeline.length; i++) {
var di = covid_total_timeline[i];
di.active = di.confirmed - di.recovered;
}
// function that returns current slide
// if index is not set, get last slide
function getSlideData(index) {
if (index == undefined) {
index = covid_world_timeline.length - 1;
}
var data = covid_world_timeline[index];
// augment with names
//for (var i = 0; i < data.list.length; i++) {
//data.list[i].name = idToName(data.list[i].id);
//}
return data;
}
// get slide data
var slideData = getSlideData();
// as we will be modifying raw data, make a copy
var mapData = JSON.parse(JSON.stringify(slideData.list));
// remove items with 0 values for better performance
for(var i = mapData.length - 1; i >= 0; i--){
if(mapData[i].confirmed == 0){
mapData.splice(i, 1);
}
}
var max = { confirmed: 0, recovered: 0, deaths: 0 };
var maxPC = { confirmed: 0, recovered: 0, deaths: 0, active: 0 };
// the last day will have most
for (var i = 0; i < mapData.length; i++) {
var di = mapData[i];
if (di.confirmed > max.confirmed) {
max.confirmed = di.confirmed;
}
if (di.recovered > max.recovered) {
max.recovered = di.recovered;
}
if (di.deaths > max.deaths) {
max.deaths = di.deaths
}
max.active = max.confirmed;
}
// END OF DATA
//////////////////////////////////////////////////////////////////////////////
// LAYOUT & CHARTS
//////////////////////////////////////////////////////////////////////////////
// main container
// https://www.amcharts.com/docs/v4/concepts/svg-engine/containers/
var container = am4core.create("chartdiv", am4core.Container);
container.width = am4core.percent(100);
container.height = am4core.percent(100);
container.tooltip = new am4core.Tooltip();
container.tooltip.background.fill = am4core.color("#000000");
container.tooltip.background.stroke = activeColor;
container.tooltip.fontSize = "0.9em";
container.tooltip.getFillFromObject = false;
container.tooltip.getStrokeFromObject = false;
// MAP CHART
// https://www.amcharts.com/docs/v4/chart-types/map/
var mapChart = container.createChild(am4maps.MapChart);
mapChart.height = am4core.percent(80);
mapChart.zoomControl = new am4maps.ZoomControl();
mapChart.zoomControl.align = "right";
mapChart.zoomControl.marginRight = 15;
mapChart.zoomControl.valign = "middle";
mapChart.homeGeoPoint = { longitude: 0, latitude: -2 };
// by default minus button zooms out by one step, but we modify the behavior so when user clicks on minus, the map would fully zoom-out and show world data
mapChart.zoomControl.minusButton.events.on("hit", showWorld);
// clicking on a "sea" will also result a full zoom-out
mapChart.seriesContainer.background.events.on("hit", showWorld);
mapChart.seriesContainer.background.events.on("over", resetHover);
mapChart.seriesContainer.background.fillOpacity = 0;
mapChart.zoomEasing = am4core.ease.sinOut;
// https://www.amcharts.com/docs/v4/chart-types/map/#Map_data
// you can use more accurate world map or map of any other country - a wide selection of maps available at: https://github.com/amcharts/amcharts4-geodata
mapChart.geodata = am4geodata_worldLow;
// Set projection
// https://www.amcharts.com/docs/v4/chart-types/map/#Setting_projection
// instead of Miller, you can use Mercator or many other projections available: https://www.amcharts.com/demos-v4/map-using-d3-projections/
mapChart.projection = new am4maps.projections.Miller();
mapChart.panBehavior = "move";
// when map is globe, beackground is made visible
mapChart.backgroundSeries.mapPolygons.template.polygon.fillOpacity = 0.05;
mapChart.backgroundSeries.mapPolygons.template.polygon.fill = am4core.color("#ffffff");
mapChart.backgroundSeries.hidden = true;
// Map polygon series (defines how country areas look and behave)
var polygonSeries = mapChart.series.push(new am4maps.MapPolygonSeries());
polygonSeries.dataFields.id = "id";
polygonSeries.dataFields.value = "confirmedPC";
polygonSeries.interpolationDuration = 0;
polygonSeries.exclude = ["AQ"]; // Antarctica is excluded in non-globe projection
polygonSeries.useGeodata = true;
polygonSeries.nonScalingStroke = true;
polygonSeries.strokeWidth = 0.5;
// this helps to place bubbles in the visual middle of the area
polygonSeries.calculateVisualCenter = true;
polygonSeries.data = mapData;
var polygonTemplate = polygonSeries.mapPolygons.template;
polygonTemplate.fill = countryColor;
polygonTemplate.fillOpacity = 1
polygonTemplate.stroke = countryStrokeColor;
polygonTemplate.strokeOpacity = 0.15
polygonTemplate.setStateOnChildren = true;
polygonTemplate.tooltipPosition = "fixed";
polygonTemplate.events.on("hit", handleCountryHit);
polygonTemplate.events.on("over", handleCountryOver);
polygonTemplate.events.on("out", handleCountryOut);
polygonSeries.heatRules.push({
"target": polygonTemplate,
"property": "fill",
"min": countryColor,
"max": countryColor,
"dataField": "value"
})
// you can have pacific - centered map if you set this to -154.8
mapChart.deltaLongitude = -10;
// polygon states
var polygonHoverState = polygonTemplate.states.create("hover");
polygonHoverState.transitionDuration = 1400;
polygonHoverState.properties.fill = countryHoverColor;
var polygonActiveState = polygonTemplate.states.create("active")
polygonActiveState.properties.fill = activeCountryColor;
// Bubble series
var bubbleSeries = mapChart.series.push(new am4maps.MapImageSeries());
bubbleSeries.data = JSON.parse(JSON.stringify(mapData));
bubbleSeries.dataFields.value = "confirmed";
bubbleSeries.dataFields.id = "id";
// adjust tooltip
bubbleSeries.tooltip.animationDuration = 0;
bubbleSeries.tooltip.showInViewport = false;
bubbleSeries.tooltip.background.fillOpacity = 0.2;
bubbleSeries.tooltip.getStrokeFromObject = true;
bubbleSeries.tooltip.getFillFromObject = false;
bubbleSeries.tooltip.background.fillOpacity = 0.2;
bubbleSeries.tooltip.background.fill = am4core.color("#000000");
var imageTemplate = bubbleSeries.mapImages.template;
// if you want bubbles to become bigger when zoomed, set this to false
imageTemplate.nonScaling = true;
imageTemplate.strokeOpacity = 0;
imageTemplate.fillOpacity = 0.55;
imageTemplate.tooltipText = "{name}: [bold]{value}[/]";
imageTemplate.applyOnClones = true;
imageTemplate.events.on("over", handleImageOver);
imageTemplate.events.on("out", handleImageOut);
imageTemplate.events.on("hit", handleImageHit);
// this is needed for the tooltip to point to the top of the circle instead of the middle
imageTemplate.adapter.add("tooltipY", function(tooltipY, target) {
return -target.children.getIndex(0).radius;
})
// When hovered, circles become non-opaque
var imageHoverState = imageTemplate.states.create("hover");
imageHoverState.properties.fillOpacity = 1;
// add circle inside the image
var circle = imageTemplate.createChild(am4core.Circle);
// this makes the circle to pulsate a bit when showing it
circle.hiddenState.properties.scale = 0.0001;
circle.hiddenState.transitionDuration = 2000;
circle.defaultState.transitionDuration = 2000;
circle.defaultState.transitionEasing = am4core.ease.elasticOut;
// later we set fill color on template (when changing what type of data the map should show) and all the clones get the color because of this
circle.applyOnClones = true;
// heat rule makes the bubbles to be of a different width. Adjust min/max for smaller/bigger radius of a bubble
bubbleSeries.heatRules.push({
"target": circle,
"property": "radius",
"min": 3,
"max": 30,
"dataField": "value"
})
// when data items validated, hide 0 value bubbles (because min size is set)
bubbleSeries.events.on("dataitemsvalidated", function() {
bubbleSeries.dataItems.each((dataItem) => {
var mapImage = dataItem.mapImage;
var circle = mapImage.children.getIndex(0);
if (mapImage.dataItem.value == 0) {
circle.hide(0);
}
else if (circle.isHidden || circle.isHiding) {
circle.show();
}
})
})
// this places bubbles at the visual center of a country
imageTemplate.adapter.add("latitude", function(latitude, target) {
var polygon = polygonSeries.getPolygonById(target.dataItem.id);
if (polygon) {
target.disabled = false;
return polygon.visualLatitude;
}
else {
target.disabled = true;
}
return latitude;
})
imageTemplate.adapter.add("longitude", function(longitude, target) {
var polygon = polygonSeries.getPolygonById(target.dataItem.id);
if (polygon) {
target.disabled = false;
return polygon.visualLongitude;
}
else {
target.disabled = true;
}
return longitude;
})
// END OF MAP
// top title
var title = mapChart.titles.create();
title.fontSize = "1.5em";
title.text = "COVID-19 Spread Data";
title.align = "left";
title.horizontalCenter = "left";
title.marginLeft = 20;
title.paddingBottom = 10;
title.fill = am4core.color("#ffffff");
title.y = 20;
// switch between map and globe
var mapGlobeSwitch = mapChart.createChild(am4core.SwitchButton);
mapGlobeSwitch.align = "right"
mapGlobeSwitch.y = 15;
mapGlobeSwitch.leftLabel.text = "Map";
mapGlobeSwitch.leftLabel.fill = am4core.color("#ffffff");
mapGlobeSwitch.rightLabel.fill = am4core.color("#ffffff");
mapGlobeSwitch.rightLabel.text = "Globe";
mapGlobeSwitch.verticalCenter = "top";
mapGlobeSwitch.events.on("toggled", function() {
if (mapGlobeSwitch.isActive) {
mapChart.projection = new am4maps.projections.Orthographic;
mapChart.backgroundSeries.show();
mapChart.panBehavior = "rotateLongLat";
polygonSeries.exclude = [];
} else {
mapChart.projection = new am4maps.projections.Miller;
mapChart.backgroundSeries.hide();
mapChart.panBehavior = "move";
removeAntarctica(mapData);
polygonSeries.data = mapData;
polygonSeries.exclude = ["AQ"];
}
})
// switch between map and globe
var absolutePerCapitaSwitch = mapChart.createChild(am4core.SwitchButton);
absolutePerCapitaSwitch.align = "center"
absolutePerCapitaSwitch.y = 15;
absolutePerCapitaSwitch.leftLabel.text = "Absolute";
absolutePerCapitaSwitch.leftLabel.fill = am4core.color("#ffffff");
absolutePerCapitaSwitch.rightLabel.fill = am4core.color("#ffffff");
absolutePerCapitaSwitch.rightLabel.text = "Per Capita";
absolutePerCapitaSwitch.rightLabel.interactionsEnabled = true;
absolutePerCapitaSwitch.rightLabel.tooltipText = "When calculating max value, countries with population less than 100.000 are not included."
absolutePerCapitaSwitch.verticalCenter = "top";
absolutePerCapitaSwitch.events.on("toggled", function() {
if (absolutePerCapitaSwitch.isActive) {
bubbleSeries.hide(0);
perCapita = true;
bubbleSeries.interpolationDuration = 0;
polygonSeries.heatRules.getIndex(0).max = colors[currentType];
polygonSeries.heatRules.getIndex(0).maxValue = maxPC[currentType];
polygonSeries.mapPolygons.template.applyOnClones = true;
sizeSlider.hide()
filterSlider.hide();
sizeLabel.hide();
filterLabel.hide();
updateCountryTooltip();
} else {
perCapita = false;
polygonSeries.interpolationDuration = 0;
bubbleSeries.interpolationDuration = 1000;
bubbleSeries.show();
polygonSeries.heatRules.getIndex(0).max = countryColor;
polygonSeries.mapPolygons.template.tooltipText = undefined;
sizeSlider.show()
filterSlider.show();
sizeLabel.show();
filterLabel.show();
}
polygonSeries.mapPolygons.each(function(mapPolygon) {
mapPolygon.fill = mapPolygon.fill;
mapPolygon.defaultState.properties.fill = undefined;
})
})
// buttons & chart container
var buttonsAndChartContainer = container.createChild(am4core.Container);
buttonsAndChartContainer.layout = "vertical";
buttonsAndChartContainer.height = am4core.percent(45); // make this bigger if you want more space for the chart
buttonsAndChartContainer.width = am4core.percent(100);
buttonsAndChartContainer.valign = "bottom";
// country name and buttons container
var nameAndButtonsContainer = buttonsAndChartContainer.createChild(am4core.Container)
nameAndButtonsContainer.width = am4core.percent(100);
nameAndButtonsContainer.padding(0, 10, 5, 20);
nameAndButtonsContainer.layout = "horizontal";
// name of a country and date label
var countryName = nameAndButtonsContainer.createChild(am4core.Label);
countryName.fontSize = "1.1em";
countryName.fill = am4core.color("#ffffff");
countryName.valign = "middle";
// buttons container (active/confirmed/recovered/deaths)
var buttonsContainer = nameAndButtonsContainer.createChild(am4core.Container);
buttonsContainer.layout = "grid";
buttonsContainer.width = am4core.percent(100);
buttonsContainer.x = 10;
buttonsContainer.contentAlign = "right";
// Chart & slider container
var chartAndSliderContainer = buttonsAndChartContainer.createChild(am4core.Container);
chartAndSliderContainer.layout = "vertical";
chartAndSliderContainer.height = am4core.percent(100);
chartAndSliderContainer.width = am4core.percent(100);
chartAndSliderContainer.background = new am4core.RoundedRectangle();
chartAndSliderContainer.background.fill = am4core.color("#000000");
chartAndSliderContainer.background.cornerRadius(30, 30, 0, 0)
chartAndSliderContainer.background.fillOpacity = 0.25;
chartAndSliderContainer.paddingTop = 12;
chartAndSliderContainer.paddingBottom = 0;
// Slider container
var sliderContainer = chartAndSliderContainer.createChild(am4core.Container);
sliderContainer.width = am4core.percent(100);
sliderContainer.padding(0, 15, 15, 10);
sliderContainer.layout = "horizontal";
var slider = sliderContainer.createChild(am4core.Slider);
slider.width = am4core.percent(100);
slider.valign = "middle";
slider.background.opacity = 0.4;
slider.opacity = 0.7;
slider.background.fill = am4core.color("#ffffff");
slider.marginLeft = 20;
slider.marginRight = 35;
slider.height = 15;
slider.start = 1;
// what to do when slider is dragged
slider.events.on("rangechanged", function(event) {
var index = Math.round((covid_world_timeline.length - 1) * slider.start);
updateMapData(getSlideData(index).list);
updateTotals(index);
})
// stop animation if dragged
slider.startGrip.events.on("drag", () => {
stop();
if (sliderAnimation) {
sliderAnimation.setProgress(slider.start);
}
});
// play button
var playButton = sliderContainer.createChild(am4core.PlayButton);
playButton.valign = "middle";
// play button behavior
playButton.events.on("toggled", function(event) {
if (event.target.isActive) {
play();
} else {
stop();
}
})
// make slider grip look like play button
slider.startGrip.background.fill = playButton.background.fill;
slider.startGrip.background.strokeOpacity = 0;
slider.startGrip.icon.stroke = am4core.color("#ffffff");
slider.startGrip.background.states.copyFrom(playButton.background.states)
// bubble size slider
var sizeSlider = container.createChild(am4core.Slider);
sizeSlider.orientation = "vertical";
sizeSlider.height = am4core.percent(12);
sizeSlider.marginLeft = 25;
sizeSlider.align = "left";
sizeSlider.valign = "top";
sizeSlider.verticalCenter = "middle";
sizeSlider.opacity = 0.7;
sizeSlider.background.fill = am4core.color("#ffffff");
sizeSlider.adapter.add("y", function(y, target) {
return container.pixelHeight * (1 - buttonsAndChartContainer.percentHeight / 100) * 0.25;
})
sizeSlider.startGrip.background.fill = activeColor;
sizeSlider.startGrip.background.fillOpacity = 0.8;
sizeSlider.startGrip.background.strokeOpacity = 0;
sizeSlider.startGrip.icon.stroke = am4core.color("#ffffff");
sizeSlider.startGrip.background.states.getKey("hover").properties.fill = activeColor;
sizeSlider.startGrip.background.states.getKey("down").properties.fill = activeColor;
sizeSlider.horizontalCenter = "middle";
sizeSlider.events.on("rangechanged", function() {
sizeSlider.startGrip.scale = 0.75 + sizeSlider.start;
bubbleSeries.heatRules.getIndex(0).max = 30 + sizeSlider.start * 100;
circle.clones.each(function(clone) {
clone.radius = clone.radius;
})
})
var sizeLabel = container.createChild(am4core.Label);
sizeLabel.text = "max bubble size *";
sizeLabel.fill = am4core.color("#ffffff");
sizeLabel.rotation = 90;
sizeLabel.fontSize = "10px";
sizeLabel.fillOpacity = 0.5;
sizeLabel.horizontalCenter = "middle";
sizeLabel.align = "left"
sizeLabel.paddingBottom = 40;
sizeLabel.tooltip.setBounds({ x: 0, y: 0, width: 200000, height: 200000 })
sizeLabel.tooltip.label.wrap = true;
sizeLabel.tooltip.label.maxWidth = 300;
sizeLabel.tooltipText = "Some countries have so many cases that bubbles for countries with smaller values often look the same even if there is a significant difference between them. This slider can be used to increase maximum size of a bubble so that when you zoom in to a region with relatively small values you could compare them anyway."
sizeLabel.fill = am4core.color("#ffffff");
sizeLabel.adapter.add("y", function(y, target) {
return container.pixelHeight * (1 - buttonsAndChartContainer.percentHeight / 100) * 0.25;
})
// filter slider
// bubble size slider
var filterSlider = container.createChild(am4core.Slider);
filterSlider.orientation = "vertical";
filterSlider.height = am4core.percent(28);
filterSlider.marginLeft = 25;
filterSlider.align = "left";
filterSlider.valign = "top";
filterSlider.verticalCenter = "middle";
filterSlider.opacity = 0.7;
filterSlider.background.fill = am4core.color("#ffffff");
filterSlider.adapter.add("y", function(y, target) {
return container.pixelHeight * (1 - buttonsAndChartContainer.percentHeight / 100) * 0.7;
})
filterSlider.startGrip.background.fill = activeColor;
filterSlider.startGrip.background.fillOpacity = 0.8;
filterSlider.startGrip.background.strokeOpacity = 0;
filterSlider.startGrip.icon.stroke = am4core.color("#ffffff");
filterSlider.startGrip.background.states.getKey("hover").properties.fill = activeColor;
filterSlider.startGrip.background.states.getKey("down").properties.fill = activeColor;
filterSlider.horizontalCenter = "middle";
filterSlider.start = 1;
filterSlider.events.on("rangechanged", function() {
var maxValue = max[currentType] * filterSlider.start + 1;
if (!isNaN(maxValue) && bubbleSeries.inited) {
bubbleSeries.heatRules.getIndex(0).maxValue = maxValue;
circle.clones.each(function(clone) {
if (clone.dataItem.value > maxValue) {
clone.dataItem.hide();
}
else {
clone.dataItem.show();
}
clone.radius = clone.radius;
})
}
})
var filterLabel = container.createChild(am4core.Label);
filterLabel.text = "filter max values *";
filterLabel.rotation = 90;
filterLabel.fontSize = "10px";
filterLabel.fill = am4core.color("#ffffff");
filterLabel.fontSize = "0.8em";
filterLabel.fillOpacity = 0.5;
filterLabel.horizontalCenter = "middle";
filterLabel.align = "left"
filterLabel.paddingBottom = 40;
filterLabel.tooltip.label.wrap = true;
filterLabel.tooltip.label.maxWidth = 300;
filterLabel.tooltipText = "This filter allows to remove countries with many cases from the map so that it would be possible to compare countries with smaller number of cases."
filterLabel.fill = am4core.color("#ffffff");
filterLabel.adapter.add("y", function(y, target) {
return container.pixelHeight * (1 - buttonsAndChartContainer.percentHeight / 100) * 0.7;
})
// play behavior
function play() {
if (!sliderAnimation) {
sliderAnimation = slider.animate({ property: "start", to: 1, from: 0 }, 50000, am4core.ease.linear).pause();
sliderAnimation.events.on("animationended", () => {
playButton.isActive = false;
})
}
if (slider.start >= 1) {
slider.start = 0;
sliderAnimation.start();
}
sliderAnimation.resume();
playButton.isActive = true;
}
// stop behavior
function stop() {
if (sliderAnimation) {
sliderAnimation.pause();
}
playButton.isActive = false;
}
// BOTTOM CHART
// https://www.amcharts.com/docs/v4/chart-types/xy-chart/
var lineChart = chartAndSliderContainer.createChild(am4charts.XYChart);
lineChart.fontSize = "0.8em";
lineChart.paddingRight = 30;
lineChart.paddingLeft = 30;
lineChart.maskBullets = false;
lineChart.zoomOutButton.disabled = true;
lineChart.paddingBottom = 5;
lineChart.paddingTop = 3;
// make a copy of data as we will be modifying it
lineChart.data = JSON.parse(JSON.stringify(covid_total_timeline));
// date axis
// https://www.amcharts.com/docs/v4/concepts/axes/date-axis/
var dateAxis = lineChart.xAxes.push(new am4charts.DateAxis());
dateAxis.renderer.minGridDistance = 50;
dateAxis.renderer.grid.template.stroke = am4core.color("#000000");
dateAxis.renderer.grid.template.strokeOpacity = 0.25;
dateAxis.max = lastDate.getTime() + am4core.time.getDuration("day", 5);
dateAxis.tooltip.label.fontSize = "0.8em";
dateAxis.tooltip.background.fill = activeColor;
dateAxis.tooltip.background.stroke = activeColor;
dateAxis.renderer.labels.template.fill = am4core.color("#ffffff");
/*
dateAxis.renderer.labels.template.adapter.add("fillOpacity", function(fillOpacity, target){
return dateAxis.valueToPosition(target.dataItem.value) + 0.1;
})*/
// value axis
// https://www.amcharts.com/docs/v4/concepts/axes/value-axis/
var valueAxis = lineChart.yAxes.push(new am4charts.ValueAxis());
valueAxis.renderer.opposite = true;
valueAxis.interpolationDuration = 3000;
valueAxis.renderer.grid.template.stroke = am4core.color("#000000");
valueAxis.renderer.grid.template.strokeOpacity = 0.25;
valueAxis.renderer.minGridDistance = 30;
valueAxis.renderer.maxLabelPosition = 0.98;
valueAxis.renderer.baseGrid.disabled = true;
valueAxis.tooltip.disabled = true;
valueAxis.extraMax = 0.05;
valueAxis.maxPrecision = 0;
valueAxis.renderer.inside = true;
valueAxis.renderer.labels.template.verticalCenter = "bottom";
valueAxis.renderer.labels.template.fill = am4core.color("#ffffff");
valueAxis.renderer.labels.template.padding(2, 2, 2, 2);
valueAxis.adapter.add("max", function(max, target) {
if (max < 5) {
max = 5
}
return max;
})
valueAxis.adapter.add("min", function(min, target) {
if (!seriesTypeSwitch.isActive) {
if (min < 0) {
min = 0;
}
}
return min;
})
// cursor
// https://www.amcharts.com/docs/v4/concepts/chart-cursor/
lineChart.cursor = new am4charts.XYCursor();
lineChart.cursor.maxTooltipDistance = 0;
lineChart.cursor.behavior = "none"; // set zoomX for a zooming possibility
lineChart.cursor.lineY.disabled = true;
lineChart.cursor.lineX.stroke = activeColor;
lineChart.cursor.xAxis = dateAxis;
// this prevents cursor to move to the clicked location while map is dragged
am4core.getInteraction().body.events.off("down", lineChart.cursor.handleCursorDown, lineChart.cursor)
am4core.getInteraction().body.events.off("up", lineChart.cursor.handleCursorUp, lineChart.cursor)
// legend
// https://www.amcharts.com/docs/v4/concepts/legend/
lineChart.legend = new am4charts.Legend();
lineChart.legend.parent = lineChart.plotContainer;
lineChart.legend.labels.template.fill = am4core.color("#ffffff");
lineChart.legend.markers.template.height = 8;
lineChart.legend.contentAlign = "left";
lineChart.legend.fontSize = "10px";
lineChart.legend.itemContainers.template.valign = "middle";
var legendDown = false;
lineChart.legend.itemContainers.template.events.on("down", function() {
legendDown = true;
})
lineChart.legend.itemContainers.template.events.on("up", function() {
setTimeout(function() {
legendDown = false;
}, 100)
})
var seriesTypeSwitch = lineChart.legend.createChild(am4core.SwitchButton);
seriesTypeSwitch.leftLabel.text = "totals";
seriesTypeSwitch.rightLabel.text = "day change"
seriesTypeSwitch.leftLabel.fill = am4core.color("#ffffff");
seriesTypeSwitch.rightLabel.fill = am4core.color("#ffffff");
seriesTypeSwitch.events.on("down", function() {
legendDown = true;
})
seriesTypeSwitch.events.on("up", function() {
setTimeout(function() {
legendDown = false;
}, 100)
})
seriesTypeSwitch.events.on("toggled", function() {
if (seriesTypeSwitch.isActive) {
if (!columnSeries) {
createColumnSeries();
}
for (var key in columnSeries) {
columnSeries[key].hide(0);
}
for (var key in series) {
series[key].hiddenInLegend = true;
series[key].hide();
}
columnSeries[currentType].show();
}
else {
for (var key in columnSeries) {
columnSeries[key].hiddenInLegend = true;
columnSeries[key].hide();
}
for (var key in series) {
series[key].hiddenInLegend = false;
series[key].hide();
}
series[currentType].show();
}
})
function updateColumnsFill() {
columnSeries.active.columns.each(function(column) {
if (column.dataItem.values.valueY.previousChange < 0) {
column.fillOpacity = 0;
column.strokeOpacity = 0.6;
}
else {
column.fillOpacity = 0.6;
column.strokeOpacity = 0;
}
})
}
// create series
var activeSeries = addSeries("active", activeColor);
// active series is visible initially
activeSeries.tooltip.disabled = true;
activeSeries.hidden = false;
var confirmedSeries = addSeries("confirmed", confirmedColor);
var recoveredSeries = addSeries("recovered", recoveredColor);
var deathsSeries = addSeries("deaths", deathsColor);
var series = { active: activeSeries, confirmed: confirmedSeries, recovered: recoveredSeries, deaths: deathsSeries };
// add series
function addSeries(name, color) {
var series = lineChart.series.push(new am4charts.LineSeries())
series.dataFields.valueY = name;
series.dataFields.dateX = "date";
series.name = capitalizeFirstLetter(name);
series.strokeOpacity = 0.6;
series.stroke = color;
series.fill = color;
series.maskBullets = false;
series.minBulletDistance = 10;
series.hidden = true;
series.hideTooltipWhileZooming = true;
// series bullet
var bullet = series.bullets.push(new am4charts.CircleBullet());
// only needed to pass it to circle
var bulletHoverState = bullet.states.create("hover");
bullet.setStateOnChildren = true;
bullet.circle.fillOpacity = 1;
bullet.circle.fill = backgroundColor;
bullet.circle.radius = 2;
var circleHoverState = bullet.circle.states.create("hover");
circleHoverState.properties.fillOpacity = 1;
circleHoverState.properties.fill = color;
circleHoverState.properties.scale = 1.4;
// tooltip setup
series.tooltip.pointerOrientation = "down";
series.tooltip.getStrokeFromObject = true;
series.tooltip.getFillFromObject = false;
series.tooltip.background.fillOpacity = 0.2;
series.tooltip.background.fill = am4core.color("#000000");
series.tooltip.dy = -4;
series.tooltip.fontSize = "0.8em";
series.tooltipText = "Total {name}: {valueY}";
return series;
}
var series = { active: activeSeries, confirmed: confirmedSeries, recovered: recoveredSeries, deaths: deathsSeries };
var columnSeries;
function createColumnSeries() {
columnSeries = {}
columnSeries.active = addColumnSeries("active", activeColor);
columnSeries.active.events.on("validated", function() {
updateColumnsFill();
})
columnSeries.confirmed = addColumnSeries("confirmed", confirmedColor);
columnSeries.recovered = addColumnSeries("recovered", recoveredColor);
columnSeries.deaths = addColumnSeries("deaths", deathsColor);
}
// add series
function addColumnSeries(name, color) {
var series = lineChart.series.push(new am4charts.ColumnSeries())
series.dataFields.valueY = name;
series.dataFields.valueYShow = "previousChange";
series.dataFields.dateX = "date";
series.name = capitalizeFirstLetter(name);
series.hidden = true;
series.stroke = color;
series.fill = color;
series.columns.template.fillOpacity = 0.6;
series.columns.template.strokeOpacity = 0;
series.hideTooltipWhileZooming = true;
series.clustered = false;
series.hiddenInLegend = true;
series.columns.template.width = am4core.percent(50);
// tooltip setup
series.tooltip.pointerOrientation = "down";
series.tooltip.getStrokeFromObject = true;
series.tooltip.getFillFromObject = false;
series.tooltip.background.fillOpacity = 0.2;
series.tooltip.background.fill = am4core.color("#000000");
series.tooltip.fontSize = "0.8em";
series.tooltipText = "{name}: {valueY.previousChange.formatNumber('+#,###|#,###|0')}";
return series;
}
lineChart.plotContainer.events.on("up", function() {
if (!legendDown) {
slider.start = lineChart.cursor.xPosition * ((dateAxis.max - dateAxis.min) / (lastDate.getTime() - dateAxis.min));
}
})
// data warning label
var label = lineChart.plotContainer.createChild(am4core.Label);
label.text = "Current day stats may be incomplete until countries submit their data.";
label.fill = am4core.color("#ffffff");
label.fontSize = "0.8em";
label.paddingBottom = 4;
label.opacity = 0.5;
label.align = "right";
label.horizontalCenter = "right";
label.verticalCenter = "bottom";
// BUTTONS
// create buttons
var activeButton = addButton("active", activeColor);
var confirmedButton = addButton("confirmed", confirmedColor);
var recoveredButton = addButton("recovered", recoveredColor);
var deathsButton = addButton("deaths", deathsColor);
var buttons = { active: activeButton, confirmed: confirmedButton, recovered: recoveredButton, deaths: deathsButton };
// add button
function addButton(name, color) {
var button = buttonsContainer.createChild(am4core.Button)
button.label.valign = "middle"
button.label.fill = am4core.color("#ffffff");
button.label.fontSize = "11px";
button.background.cornerRadius(30, 30, 30, 30);
button.background.strokeOpacity = 0.3
button.background.fillOpacity = 0;
button.background.stroke = buttonStrokeColor;
button.background.padding(2, 3, 2, 3);
button.states.create("active");
button.setStateOnChildren = true;
var activeHoverState = button.background.states.create("hoverActive");
activeHoverState.properties.fillOpacity = 0;
var circle = new am4core.Circle();
circle.radius = 8;
circle.fillOpacity = 0.3;
circle.fill = buttonStrokeColor;
circle.strokeOpacity = 0;
circle.valign = "middle";
circle.marginRight = 5;
button.icon = circle;
// save name to dummy data for later use
button.dummyData = name;
var circleActiveState = circle.states.create("active");
circleActiveState.properties.fill = color;
circleActiveState.properties.fillOpacity = 0.5;
button.events.on("hit", handleButtonClick);
return button;
}
// handle button clikc
function handleButtonClick(event) {
// we saved name to dummy data
changeDataType(event.target.dummyData);
}
// change data type (active/confirmed/recovered/deaths)
function changeDataType(name) {
currentType = name;
currentTypeName = name;
if (name != "deaths") {
currentTypeName += " cases";
}
bubbleSeries.mapImages.template.tooltipText = "[bold]{name}: {value}[/] [font-size:10px]\n" + currentTypeName;
// make button active
var activeButton = buttons[name];
activeButton.isActive = true;
// make other buttons inactive
for (var key in buttons) {
if (buttons[key] != activeButton) {
buttons[key].isActive = false;
}
}
// tell series new field name
bubbleSeries.dataFields.value = name;
polygonSeries.dataFields.value = name + "PC";
bubbleSeries.dataItems.each(function(dataItem) {
dataItem.setValue("value", dataItem.dataContext[currentType]);
})
polygonSeries.dataItems.each(function(dataItem) {
dataItem.setValue("value", dataItem.dataContext[currentType + "PC"]);
dataItem.mapPolygon.defaultState.properties.fill = undefined;
})
// change color of bubbles
// setting colors on mapImage for tooltip colors
bubbleSeries.mapImages.template.fill = colors[name];
bubbleSeries.mapImages.template.stroke = colors[name];
// first child is circle
bubbleSeries.mapImages.template.children.getIndex(0).fill = colors[name];
dateAxis.tooltip.background.fill = colors[name];
dateAxis.tooltip.background.stroke = colors[name];
lineChart.cursor.lineX.stroke = colors[name];
// show series
if (seriesTypeSwitch.isActive) {
var activeSeries = columnSeries[name];
activeSeries.show();
// hide other series
for (var key in columnSeries) {
if (columnSeries[key] != activeSeries) {
columnSeries[key].hide();
}
}
}
else {
var activeSeries = series[name];
activeSeries.show();
// hide other series
for (var key in series) {
if (series[key] != activeSeries) {
series[key].hide();
}
}
}
// update heat rule's maxValue
bubbleSeries.heatRules.getIndex(0).maxValue = max[currentType];
polygonSeries.heatRules.getIndex(0).maxValue = maxPC[currentType];
if (perCapita) {
polygonSeries.heatRules.getIndex(0).max = colors[name];
updateCountryTooltip();
}
}
// select a country
function selectCountry(mapPolygon) {
resetHover();
polygonSeries.hideTooltip();
// if the same country is clicked show world
if (currentPolygon == mapPolygon) {
currentPolygon.isActive = false;
currentPolygon = undefined;
showWorld();
return;
}
// save current polygon
currentPolygon = mapPolygon;
var countryIndex = countryIndexMap[mapPolygon.dataItem.id];
currentCountry = mapPolygon.dataItem.dataContext.name;
// make others inactive
polygonSeries.mapPolygons.each(function(polygon) {
polygon.isActive = false;
})
// clear timeout if there is one
if (countryDataTimeout) {
clearTimeout(countryDataTimeout);
}
// we delay change of data for better performance (so that data is not changed whil zooming)
countryDataTimeout = setTimeout(function() {
setCountryData(countryIndex);
}, 1000); // you can adjust number, 1000 is one second
updateTotals(currentIndex);
updateCountryName();
mapPolygon.isActive = true;
// meaning it's globe
if (mapGlobeSwitch.isActive) {
// animate deltas (results the map to be rotated to the selected country)
if (mapChart.zoomLevel != 1) {
mapChart.goHome();
rotateAndZoom(mapPolygon);
}
else {
rotateAndZoom(mapPolygon);
}
}
// if it's not a globe, simply zoom to the country
else {
mapChart.zoomToMapObject(mapPolygon, getZoomLevel(mapPolygon));
}
}
// change line chart data to the selected countries
function setCountryData(countryIndex) {
// instead of setting whole data array, we modify current raw data so that a nice animation would happen
for (var i = 0; i < lineChart.data.length; i++) {
var di = covid_world_timeline[i].list;
var countryData = di[countryIndex];
var dataContext = lineChart.data[i];
if (countryData) {
dataContext.recovered = countryData.recovered;
dataContext.confirmed = countryData.confirmed;
dataContext.deaths = countryData.deaths;
dataContext.active = countryData.confirmed - countryData.recovered - countryData.deaths;
valueAxis.min = undefined;
valueAxis.max = undefined;
}
else {
dataContext.recovered = 0;
dataContext.confirmed = 0;
dataContext.deaths = 0;
dataContext.active = 0;
valueAxis.min = 0;
valueAxis.max = 10;
}
}
lineChart.invalidateRawData();
updateTotals(currentIndex);
setTimeout(updateSeriesTooltip, 1000);
}
function updateSeriesTooltip() {
var position = dateAxis.dateToPosition(currentDate);
position = dateAxis.toGlobalPosition(position);
var x = dateAxis.positionToCoordinate(position);
lineChart.cursor.triggerMove({ x: x, y: 0 }, "soft", true);
lineChart.series.each(function(series) {
if (!series.isHidden) {
series.tooltip.disabled = false;
series.showTooltipAtDataItem(series.tooltipDataItem);
}
})
}
// what happens when a country is rolled-over
function rollOverCountry(mapPolygon) {
resetHover();
if (mapPolygon) {
mapPolygon.isHover = true;
// make bubble hovered too
var image = bubbleSeries.getImageById(mapPolygon.dataItem.id);
if (image) {
image.dataItem.dataContext.name = mapPolygon.dataItem.dataContext.name;
image.isHover = true;
}
}
}
// what happens when a country is rolled-out
function rollOutCountry(mapPolygon) {
var image = bubbleSeries.getImageById(mapPolygon.dataItem.id)
resetHover();
if (image) {
image.isHover = false;
}
}
// rotate and zoom
function rotateAndZoom(mapPolygon) {
polygonSeries.hideTooltip();
var animation = mapChart.animate([{ property: "deltaLongitude", to: -mapPolygon.visualLongitude }, { property: "deltaLatitude", to: -mapPolygon.visualLatitude }], 1000)
animation.events.on("animationended", function() {
mapChart.zoomToMapObject(mapPolygon, getZoomLevel(mapPolygon));
})
}
// calculate zoom level (default is too close)
function getZoomLevel(mapPolygon) {
var w = mapPolygon.polygon.bbox.width;
var h = mapPolygon.polygon.bbox.width;
// change 2 to smaller walue for a more close zoom
return Math.min(mapChart.seriesWidth / (w * 2), mapChart.seriesHeight / (h * 2))
}
// show world data
function showWorld() {
currentCountry = "World";
currentPolygon = undefined;
resetHover();
if (countryDataTimeout) {
clearTimeout(countryDataTimeout);
}
// make all inactive
polygonSeries.mapPolygons.each(function(polygon) {
polygon.isActive = false;
})
updateCountryName();
// update line chart data (again, modifying instead of setting new data for a nice animation)
for (var i = 0; i < lineChart.data.length; i++) {
var di = covid_total_timeline[i];
var dataContext = lineChart.data[i];
dataContext.recovered = di.recovered;
dataContext.confirmed = di.confirmed;
dataContext.deaths = di.deaths;
dataContext.active = di.confirmed - di.recovered;
valueAxis.min = undefined;
valueAxis.max = undefined;
}
lineChart.invalidateRawData();
updateTotals(currentIndex);
mapChart.goHome();
}
// updates country name and date
function updateCountryName() {
countryName.text = currentCountry + ", " + mapChart.dateFormatter.format(currentDate, "MMM dd, yyyy");
}
// update total values in buttons
function updateTotals(index) {
if (!isNaN(index)) {
var di = covid_total_timeline[index];
var date = new Date(di.date);
currentDate = date;
updateCountryName();
var position = dateAxis.dateToPosition(date);
position = dateAxis.toGlobalPosition(position);
var x = dateAxis.positionToCoordinate(position);
if (lineChart.cursor) {
lineChart.cursor.triggerMove({ x: x, y: 0 }, "soft", true);
}
for (var key in buttons) {
var count = Number(lineChart.data[index][key])
if (!isNaN(count)) {
buttons[key].label.text = capitalizeFirstLetter(key) + ": " + numberFormatter.format(count, '#,###');
}
}
currentIndex = index;
}
}
// update map data
function updateMapData(data) {
//modifying instead of setting new data for a nice animation
bubbleSeries.dataItems.each(function(dataItem) {
dataItem.dataContext.confirmed = 0;
dataItem.dataContext.deaths = 0;
dataItem.dataContext.recovered = 0;
dataItem.dataContext.active = 0;
})
maxPC = { active: 0, confirmed: 0, deaths: 0, recovered: 0 };
for (var i = 0; i < data.length; i++) {
var di = data[i];
var image = bubbleSeries.getImageById(di.id);
var polygon = polygonSeries.getPolygonById(di.id);
if (image) {
var population = Number(populations[image.dataItem.dataContext.id]);
image.dataItem.dataContext.confirmed = di.confirmed;
image.dataItem.dataContext.deaths = di.deaths;
image.dataItem.dataContext.recovered = di.recovered;
image.dataItem.dataContext.active = di.confirmed - di.recovered - di.deaths;
}
if (polygon) {
polygon.dataItem.dataContext.confirmedPC = di.confirmed / population * 1000000;
polygon.dataItem.dataContext.deathsPC = di.deaths / population * 1000000;
polygon.dataItem.dataContext.recoveredPC = di.recovered / population * 1000000;
polygon.dataItem.dataContext.active = di.confirmed - di.recovered - di.deaths;
polygon.dataItem.dataContext.activePC = polygon.dataItem.dataContext.active / population * 1000000;
if (population > 100000) {
if (polygon.dataItem.dataContext.confirmedPC > maxPC.confirmed) {
maxPC.confirmed = polygon.dataItem.dataContext.confirmedPC;
}
if (polygon.dataItem.dataContext.deathsPC > maxPC.deaths) {
maxPC.deaths = polygon.dataItem.dataContext.deathsPC;
}
if (polygon.dataItem.dataContext.recoveredPC > maxPC.recovered) {
maxPC.recovered = polygon.dataItem.dataContext.recoveredPC;
}
if (polygon.dataItem.dataContext.activePC > maxPC.active) {
maxPC.active = polygon.dataItem.dataContext.activePC;
}
}
}
bubbleSeries.heatRules.getIndex(0).maxValue = max[currentType];
polygonSeries.heatRules.getIndex(0).maxValue = maxPC[currentType];
bubbleSeries.invalidateRawData();
polygonSeries.invalidateRawData();
}
}
// capitalize first letter
function capitalizeFirstLetter(string) {
return string.charAt(0).toUpperCase() + string.slice(1);
}
function handleImageOver(event) {
rollOverCountry(polygonSeries.getPolygonById(event.target.dataItem.id));
}
function handleImageOut(event) {
rollOutCountry(polygonSeries.getPolygonById(event.target.dataItem.id));
}
function handleImageHit(event) {
selectCountry(polygonSeries.getPolygonById(event.target.dataItem.id));
}
function handleCountryHit(event) {
selectCountry(event.target);
}
function handleCountryOver(event) {
rollOverCountry(event.target);
}
function handleCountryOut(event) {
rollOutCountry(event.target);
}
function resetHover() {
polygonSeries.mapPolygons.each(function(polygon) {
polygon.isHover = false;
})
bubbleSeries.mapImages.each(function(image) {
image.isHover = false;
})
}
container.events.on("layoutvalidated", function() {
dateAxis.tooltip.hide();
lineChart.cursor.hide();
updateTotals(currentIndex);
});
// set initial data and names
updateCountryName();
changeDataType("active");
//populateCountries(slideData.list);
setTimeout(updateSeriesTooltip, 3000);
function updateCountryTooltip() {
polygonSeries.mapPolygons.template.tooltipText = "[bold]{name}: {value.formatNumber('#.')}[/]\n[font-size:10px]" + currentTypeName + " per million"
}
/**
* Country/state list on the right
*/
/*
function populateCountries(list) {
var table = $("#areas tbody");
table.find(".area").remove();
for (var i = 0; i < list.length; i++) {
var area = list[i];
var tr = $("<tr>").addClass("area").data("areaid", area.id).appendTo(table).on("click", function() {
selectCountry(polygonSeries.getPolygonById($(this).data("areaid")));
}).hover(function() {
rollOverCountry(polygonSeries.getPolygonById($(this).data("areaid")));
});
$("<td>").appendTo(tr).data("areaid", area.id).html(area.name);
$("<td>").addClass("value").appendTo(tr).html(area.confirmed);
$("<td>").addClass("value").appendTo(tr).html(area.deaths);
$("<td>").addClass("value").appendTo(tr).html(area.recovered);
}
$("#areas").DataTable({
"paging": false,
"select": true
}).column("1")
.order("desc")
.draw();;
}
*/
//function idToName(id) {
//return am4geodata_data_countries2[id] ? am4geodata_data_countries2[id].country : id == "XX" ? "Others" : id;
//}
function removeAntarctica(mapData) {
for (var i = mapData.length - 1; i >= 0; i--) {
if (mapData[i].id == "AQ") {
mapData.splice(i, 1);
}
}
}
var populations = {
"AD": "84000",
"AE": "4975593",
"AF": "29121286",
"AG": "86754",
"AI": "13254",
"AL": "2986952",
"AM": "2968000",
"AN": "300000",
"AO": "13068161",
"AQ": "0",
"AR": "41343201",
"AS": "57881",
"AT": "8205000",
"AU": "21515754",
"AW": "71566",
"AX": "26711",
"AZ": "8303512",
"BA": "4590000",
"BB": "285653",
"BD": "156118464",
"BE": "10403000",
"BF": "16241811",
"BG": "7148785",
"BH": "738004",
"BI": "9863117",
"BJ": "9056010",
"BL": "8450",
"BM": "65365",
"BN": "395027",
"BO": "9947418",
"BQ": "18012",
"BR": "201103330",
"BS": "301790",
"BT": "699847",
"BV": "0",
"BW": "2029307",
"BY": "9685000",
"BZ": "314522",
"CA": "33679000",
"CC": "628",
"CD": "70916439",
"CF": "4844927",
"CG": "3039126",
"CH": "7581000",
"CI": "21058798",
"CK": "21388",
"CL": "16746491",
"CM": "19294149",
"CN": "1330044000",
"CO": "47790000",
"CR": "4516220",
"CS": "10829175",
"CU": "11423000",
"CV": "508659",
"CW": "141766",
"CX": "1500",
"CY": "1102677",
"CZ": "10476000",
"DE": "81802257",
"DJ": "740528",
"DK": "5484000",
"DM": "72813",
"DO": "9823821",
"DZ": "34586184",
"EC": "14790608",
"EE": "1291170",
"EG": "80471869",
"EH": "273008",
"ER": "5792984",
"ES": "46505963",
"ET": "88013491",
"FI": "5244000",
"FJ": "875983",
"FK": "2638",
"FM": "107708",
"FO": "48228",
"FR": "64768389",
"GA": "1545255",
"GB": "62348447",
"GD": "107818",
"GE": "4630000",
"GF": "195506",
"GG": "65228",
"GH": "24339838",
"GI": "27884",
"GL": "56375",
"GM": "1593256",
"GN": "10324025",
"GP": "443000",
"GQ": "1014999",
"GR": "11000000",
"GS": "30",
"GT": "13550440",
"GU": "159358",
"GW": "1565126",
"GY": "748486",
"HK": "6898686",
"HM": "0",
"HN": "7989415",
"HR": "4284889",
"HT": "9648924",
"HU": "9982000",
"ID": "242968342",
"IE": "4622917",
"IL": "7353985",
"IM": "75049",
"IN": "1173108018",
"IO": "4000",
"IQ": "29671605",
"IR": "76923300",
"IS": "308910",
"IT": "60340328",
"JE": "90812",
"JM": "2847232",
"JO": "6407085",
"JP": "127288000",
"KE": "40046566",
"KG": "5776500",
"KH": "14453680",
"KI": "92533",
"KM": "773407",
"KN": "51134",
"KP": "22912177",
"KR": "48422644",
"KW": "2789132",
"KY": "44270",
"KZ": "15340000",
"LA": "6368162",
"LB": "4125247",
"LC": "160922",
"LI": "35000",
"LK": "21513990",
"LR": "3685076",
"LS": "1919552",
"LT": "2944459",
"LU": "497538",
"LV": "2217969",
"LY": "6461454",
"MA": "33848242",
"MC": "32965",
"MD": "4324000",
"ME": "666730",
"MF": "35925",
"MG": "21281844",
"MH": "65859",
"MK": "2062294",
"ML": "13796354",
"MM": "53414374",
"MN": "3086918",
"MO": "449198",
"MP": "53883",
"MQ": "432900",
"MR": "3205060",
"MS": "9341",
"MT": "403000",
"MU": "1294104",
"MV": "395650",
"MW": "15447500",
"MX": "112468855",
"MY": "28274729",
"MZ": "22061451",
"NA": "2128471",
"NC": "216494",
"NE": "15878271",
"NF": "1828",
"NG": "154000000",
"NI": "5995928",
"NL": "16645000",
"NO": "5009150",
"NP": "28951852",
"NR": "10065",
"NU": "2166",
"NZ": "4252277",
"OM": "2967717",
"PA": "3410676",
"PE": "29907003",
"PF": "270485",
"PG": "6064515",
"PH": "99900177",
"PK": "184404791",
"PL": "38500000",
"PM": "7012",
"PN": "46",
"PR": "3916632",
"PS": "3800000",
"PT": "10676000",
"PW": "19907",
"PY": "6375830",
"QA": "840926",
"RE": "776948",
"RO": "21959278",
"RS": "7344847",
"RU": "140702000",
"RW": "11055976",
"SA": "25731776",
"SB": "559198",
"SC": "88340",
"SD": "35000000",
"SE": "9828655",
"SG": "4701069",
"SH": "7460",
"SI": "2007000",
"SJ": "2550",
"SK": "5455000",
"SL": "5245695",
"SM": "31477",
"SN": "12323252",
"SO": "10112453",
"SR": "492829",
"SS": "8260490",
"ST": "175808",
"SV": "6052064",
"SX": "37429",
"SY": "22198110",
"SZ": "1354051",
"TC": "20556",
"TD": "10543464",
"TF": "140",
"TG": "6587239",
"TH": "67089500",
"TJ": "7487489",
"TK": "1466",
"TL": "1154625",
"TM": "4940916",
"TN": "10589025",
"TO": "122580",
"TR": "77804122",
"TT": "1228691",
"TV": "10472",
"TW": "22894384",
"TZ": "41892895",
"UA": "45415596",
"UG": "33398682",
"UM": "0",
"US": "310232863",
"UY": "3477000",
"UZ": "27865738",
"VA": "921",
"VC": "104217",
"VE": "27223228",
"VG": "21730",
"VI": "108708",
"VN": "89571130",
"VU": "221552",
"WF": "16025",
"WS": "192001",
"XK": "1800000",
"YE": "23495361",
"YT": "159042",
"ZA": "49000000",
"ZM": "13460305",
"ZW": "13061000"
}
});
}); // end am4core.ready()
</script>
<!-- HTML -->
<div id="chartdiv"></div>