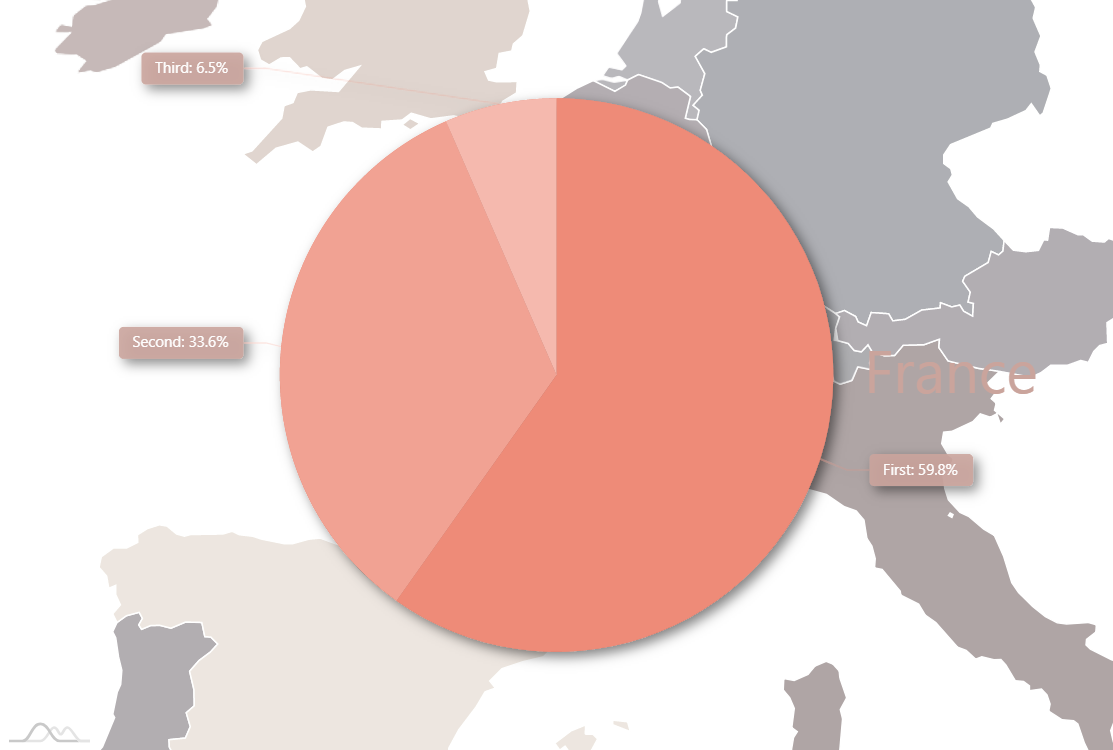
Countries morphing to pie charts
Advanced capabilities of amCharts 4 enable you to break out of the dated paradigms of UI and data visualization. Now you can implement beautiful map drill-down charts without any additional UI elements.
For an extensive tutorial make sure you check out this article on CSS-tricks.
Demo source
<!-- Styles -->
<style>
#chartdiv {
  width: 100%;
  height: 500px;
}
</style>

<!-- Resources -->
<script src="https://cdn.amcharts.com/lib/4/core.js"></script>
<script src="https://cdn.amcharts.com/lib/4/charts.js"></script>
<script src="https://cdn.amcharts.com/lib/4/maps.js"></script>
<script src="https://cdn.amcharts.com/lib/4/geodata/worldHigh.js"></script>
<script src="https://cdn.amcharts.com/lib/4/themes/animated.js"></script>

<!-- Chart code -->
<script>
am4core.ready(function() {

// Themes begin
am4core.useTheme(am4themes_animated);
// Themes end


var chart = am4core.create("chartdiv", am4maps.MapChart);


try {
    chart.geodata = am4geodata_worldHigh;
}
catch (e) {
    chart.raiseCriticalError(new Error("Map geodata could not be loaded. Please download the latest <a href=\"https://www.amcharts.com/download/download-v4/\">amcharts geodata</a> and extract its contents into the same directory as your amCharts files."));
}

chart.projection = new am4maps.projections.Mercator();

// zoomout on background click
chart.chartContainer.background.events.on("hit", function () { zoomOut() });

var colorSet = new am4core.ColorSet();
var morphedPolygon;

// map polygon series (countries)
var polygonSeries = chart.series.push(new am4maps.MapPolygonSeries());
polygonSeries.useGeodata = true;
// specify which countries to include
polygonSeries.include = ["IT", "CH", "FR", "DE", "GB", "ES", "PT", "IE", "NL", "LU", "BE", "AT", "DK"]

// country area look and behavior
var polygonTemplate = polygonSeries.mapPolygons.template;
polygonTemplate.strokeOpacity = 1;
polygonTemplate.stroke = am4core.color("#ffffff");
polygonTemplate.fillOpacity = 0.5;
polygonTemplate.tooltipText = "{name}";

// desaturate filter for countries
var desaturateFilter = new am4core.DesaturateFilter();
desaturateFilter.saturation = 0.25;
polygonTemplate.filters.push(desaturateFilter);

// take a color from color set
polygonTemplate.adapter.add("fill", function (fill, target) {
    return colorSet.getIndex(target.dataItem.index + 1);
})

// set fillOpacity to 1 when hovered
var hoverState = polygonTemplate.states.create("hover");
hoverState.properties.fillOpacity = 1;

// what to do when country is clicked
polygonTemplate.events.on("hit", function (event) {
    event.target.zIndex = 1000000;
    selectPolygon(event.target);
})

// Pie chart
var pieChart = chart.seriesContainer.createChild(am4charts.PieChart);
// Set width/heigh of a pie chart for easier positioning only
pieChart.width = 100;
pieChart.height = 100;
pieChart.hidden = true; // can't use visible = false!

// because defauls are 50, and it's not good with small countries
pieChart.chartContainer.minHeight = 1;
pieChart.chartContainer.minWidth = 1;

var pieSeries = pieChart.series.push(new am4charts.PieSeries());
pieSeries.dataFields.value = "value";
pieSeries.dataFields.category = "category";
pieSeries.data = [{ value: 100, category: "First" }, { value: 20, category: "Second" }, { value: 10, category: "Third" }];

var dropShadowFilter = new am4core.DropShadowFilter();
dropShadowFilter.blur = 4;
pieSeries.filters.push(dropShadowFilter);

var sliceTemplate = pieSeries.slices.template;
sliceTemplate.fillOpacity = 1;
sliceTemplate.strokeOpacity = 0;

var activeState = sliceTemplate.states.getKey("active");
activeState.properties.shiftRadius = 0; // no need to pull on click, as country circle under the pie won't make it good

var sliceHoverState = sliceTemplate.states.getKey("hover");
sliceHoverState.properties.shiftRadius = 0; // no need to pull on click, as country circle under the pie won't make it good

// we don't need default pie chart animation, so change defaults
var hiddenState = pieSeries.hiddenState;
hiddenState.properties.startAngle = pieSeries.startAngle;
hiddenState.properties.endAngle = pieSeries.endAngle;
hiddenState.properties.opacity = 0;
hiddenState.properties.visible = false;

// series labels
var labelTemplate = pieSeries.labels.template;
labelTemplate.nonScaling = true;
labelTemplate.fill = am4core.color("#FFFFFF");
labelTemplate.fontSize = 10;
labelTemplate.background = new am4core.RoundedRectangle();
labelTemplate.background.fillOpacity = 0.9;
labelTemplate.padding(4, 9, 4, 9);
labelTemplate.background.fill = am4core.color("#7678a0");

// we need pie series to hide faster to avoid strange pause after country is clicked
pieSeries.hiddenState.transitionDuration = 200;

// country label
var countryLabel = chart.chartContainer.createChild(am4core.Label);
countryLabel.text = "Select a country";
countryLabel.fill = am4core.color("#7678a0");
countryLabel.fontSize = 40;

countryLabel.hiddenState.properties.dy = 1000;
countryLabel.defaultState.properties.dy = 0;
countryLabel.valign = "middle";
countryLabel.align = "right";
countryLabel.paddingRight = 50;
countryLabel.hide(0);
countryLabel.show();

// select polygon
function selectPolygon(polygon) {
    if (morphedPolygon != polygon) {
        var animation = pieSeries.hide();
        if (animation) {
            animation.events.on("animationended", function () {
                morphToCircle(polygon);
            })
        }
        else {
            morphToCircle(polygon);
        }
    }
}

// fade out all countries except selected
function fadeOut(exceptPolygon) {
    for (var i = 0; i < polygonSeries.mapPolygons.length; i++) {
        var polygon = polygonSeries.mapPolygons.getIndex(i);
        if (polygon != exceptPolygon) {
            polygon.defaultState.properties.fillOpacity = 0.5;
            polygon.animate([{ property: "fillOpacity", to: 0.5 }, { property: "strokeOpacity", to: 1 }], polygon.polygon.morpher.morphDuration);
        }
    }
}

function zoomOut() {
    if (morphedPolygon) {
        pieSeries.hide();
        morphBack();
        fadeOut();
        countryLabel.hide();
        morphedPolygon = undefined;
    }
}

function morphBack() {
    if (morphedPolygon) {
        morphedPolygon.polygon.morpher.morphBack();
        var dsf = morphedPolygon.filters.getIndex(0);
        dsf.animate({ property: "saturation", to: 0.25 }, morphedPolygon.polygon.morpher.morphDuration);
    }
}

function morphToCircle(polygon) {


    var animationDuration = polygon.polygon.morpher.morphDuration;
    // if there is a country already morphed to circle, morph it back
    morphBack();
    // morph polygon to circle
    polygon.toFront();
    polygon.polygon.morpher.morphToSingle = true;
    var morphAnimation = polygon.polygon.morpher.morphToCircle();

    polygon.strokeOpacity = 0; // hide stroke for lines not to cross countries

    polygon.defaultState.properties.fillOpacity = 1;
    polygon.animate({ property: "fillOpacity", to: 1 }, animationDuration);

    // animate desaturate filter
    var filter = polygon.filters.getIndex(0);
    filter.animate({ property: "saturation", to: 1 }, animationDuration);

    // save currently morphed polygon
    morphedPolygon = polygon;

    // fade out all other
    fadeOut(polygon);

    // hide country label
    countryLabel.hide();

    if (morphAnimation) {
        morphAnimation.events.on("animationended", function () {
            zoomToCountry(polygon);
        })
    }
    else {
        zoomToCountry(polygon);
    }
}

function zoomToCountry(polygon) {
    var zoomAnimation = chart.zoomToMapObject(polygon, 2.2, true);
    if (zoomAnimation) {
        zoomAnimation.events.on("animationended", function () {
            showPieChart(polygon);
        })
    }
    else {
        showPieChart(polygon);
    }
}


function showPieChart(polygon) {
    polygon.polygon.measure();
    var radius = polygon.polygon.measuredWidth / 2 * polygon.globalScale / chart.seriesContainer.scale;
    pieChart.width = radius * 2;
    pieChart.height = radius * 2;
    pieChart.radius = radius;

    var centerPoint = am4core.utils.spritePointToSvg(polygon.polygon.centerPoint, polygon.polygon);
    centerPoint = am4core.utils.svgPointToSprite(centerPoint, chart.seriesContainer);

    pieChart.x = centerPoint.x - radius;
    pieChart.y = centerPoint.y - radius;

    var fill = polygon.fill;
    var desaturated = fill.saturate(0.3);

    for (var i = 0; i < pieSeries.dataItems.length; i++) {
        var dataItem = pieSeries.dataItems.getIndex(i);
        dataItem.value = Math.round(Math.random() * 100);
        dataItem.slice.fill = am4core.color(am4core.colors.interpolate(
            fill.rgb,
            am4core.color("#ffffff").rgb,
            0.2 * i
        ));

        dataItem.label.background.fill = desaturated;
        dataItem.tick.stroke = fill;
    }

    pieSeries.show();
    pieChart.show();

    countryLabel.text = "{name}";
    countryLabel.dataItem = polygon.dataItem;
    countryLabel.fill = desaturated;
    countryLabel.show();
}


}); // end am4core.ready()
</script>

<!-- HTML -->
<div id="chartdiv"></div>