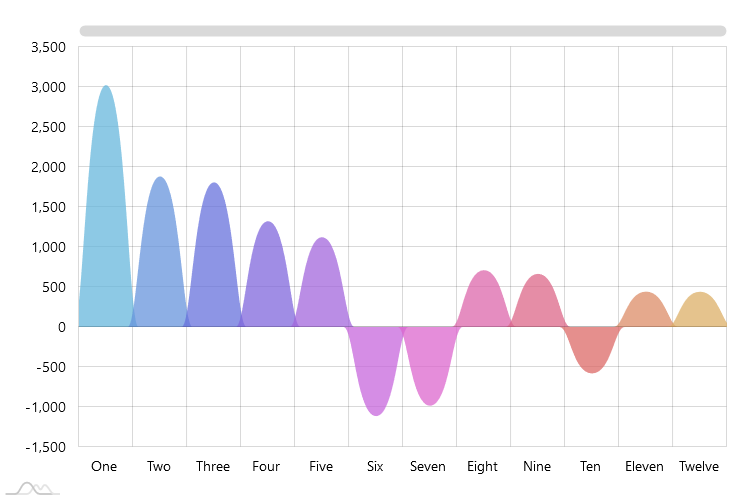
Curved columns
Curved Column Chart (also known as Curved Bar Chart) is a visual variation of a “standard” bar chart. Semantically there’s no difference between regular and curved column chart. The only difference is that columns are displayed in the shape of areas instead of regular rectangles. This gives the chart a fresher visual look while sacrificing clarity a bit, as curves of the columns have no meaning.
Demo source
<!-- Styles -->
<style>
#chartdiv {
  width: 100%;
  height: 500px;
}

</style>

<!-- Resources -->
<script src="https://cdn.amcharts.com/lib/4/core.js"></script>
<script src="https://cdn.amcharts.com/lib/4/charts.js"></script>
<script src="https://cdn.amcharts.com/lib/4/themes/animated.js"></script>

<!-- Chart code -->
<script>
am4core.ready(function() {

// Themes begin
am4core.useTheme(am4themes_animated);
// Themes end

var chart = am4core.create("chartdiv", am4charts.XYChart);
chart.hiddenState.properties.opacity = 0; // this makes initial fade in effect

chart.data = [{
  "country": "One",
  "value": 3025
}, {
  "country": "Two",
  "value": 1882
}, {
  "country": "Three",
  "value": 1809
}, {
  "country": "Four",
  "value": 1322
}, {
  "country": "Five",
  "value": 1122
}, {
  "country": "Six",
  "value": -1114
}, {
  "country": "Seven",
  "value": -984
}, {
  "country": "Eight",
  "value": 711
}, {
  "country": "Nine",
  "value": 665
}, {
  "country": "Ten",
  "value": -580
}, {
  "country": "Eleven",
  "value": 443
}, {
  "country": "Twelve",
  "value": 441
}];


var categoryAxis = chart.xAxes.push(new am4charts.CategoryAxis());
categoryAxis.renderer.grid.template.location = 0;
categoryAxis.dataFields.category = "country";
categoryAxis.renderer.minGridDistance = 40;

var valueAxis = chart.yAxes.push(new am4charts.ValueAxis());

var series = chart.series.push(new am4charts.CurvedColumnSeries());
series.dataFields.categoryX = "country";
series.dataFields.valueY = "value";
series.tooltipText = "{valueY.value}"
series.columns.template.strokeOpacity = 0;

series.columns.template.fillOpacity = 0.75;

var hoverState = series.columns.template.states.create("hover");
hoverState.properties.fillOpacity = 1;
hoverState.properties.tension = 0.4;

chart.cursor = new am4charts.XYCursor();

// Add distinctive colors for each column using adapter
series.columns.template.adapter.add("fill", function(fill, target) {
  return chart.colors.getIndex(target.dataItem.index);
});

chart.scrollbarX = new am4core.Scrollbar();

}); // end am4core.ready()
</script>

<!-- HTML -->
<div id="chartdiv"></div>