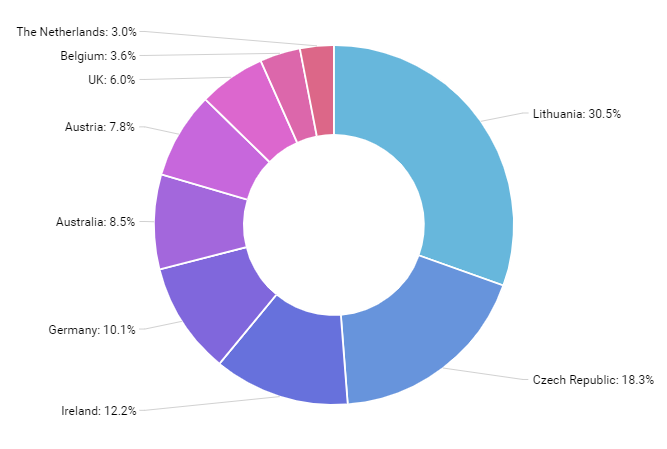
Donut chart
Donut Chart (also known as Doughnut chart) is a variation on a Pie chart except it has a round hole in the center which makes it look like a donut, hence the name. This empty space can be used to display additional data.
Configurable inner radius
To make a donut chart out of a regular pie chart, we simply need to set innerRadius property of the chart.
It can either take relative percent value, or fixed pixel radius.
Demo source
<!-- Styles -->
<style>
#chartdiv {
  width: 100%;
  height: 500px;
}

</style>

<!-- Resources -->
<script src="https://cdn.amcharts.com/lib/4/core.js"></script>
<script src="https://cdn.amcharts.com/lib/4/charts.js"></script>
<script src="https://cdn.amcharts.com/lib/4/themes/animated.js"></script>

<!-- Chart code -->
<script>
am4core.ready(function() {

// Themes begin
am4core.useTheme(am4themes_animated);
// Themes end

// Create chart instance
var chart = am4core.create("chartdiv", am4charts.PieChart);

// Add data
chart.data = [ {
  "country": "Lithuania",
  "litres": 501.9
}, {
  "country": "Czechia",
  "litres": 301.9
}, {
  "country": "Ireland",
  "litres": 201.1
}, {
  "country": "Germany",
  "litres": 165.8
}, {
  "country": "Australia",
  "litres": 139.9
}, {
  "country": "Austria",
  "litres": 128.3
}, {
  "country": "UK",
  "litres": 99
}, {
  "country": "Belgium",
  "litres": 60
}, {
  "country": "The Netherlands",
  "litres": 50
} ];

// Set inner radius
chart.innerRadius = am4core.percent(50);

// Add and configure Series
var pieSeries = chart.series.push(new am4charts.PieSeries());
pieSeries.dataFields.value = "litres";
pieSeries.dataFields.category = "country";
pieSeries.slices.template.stroke = am4core.color("#fff");
pieSeries.slices.template.strokeWidth = 2;
pieSeries.slices.template.strokeOpacity = 1;

// This creates initial animation
pieSeries.hiddenState.properties.opacity = 1;
pieSeries.hiddenState.properties.endAngle = -90;
pieSeries.hiddenState.properties.startAngle = -90;

}); // end am4core.ready()
</script>

<!-- HTML -->
<div id="chartdiv"></div>