Drawing chart series with mouse or touch
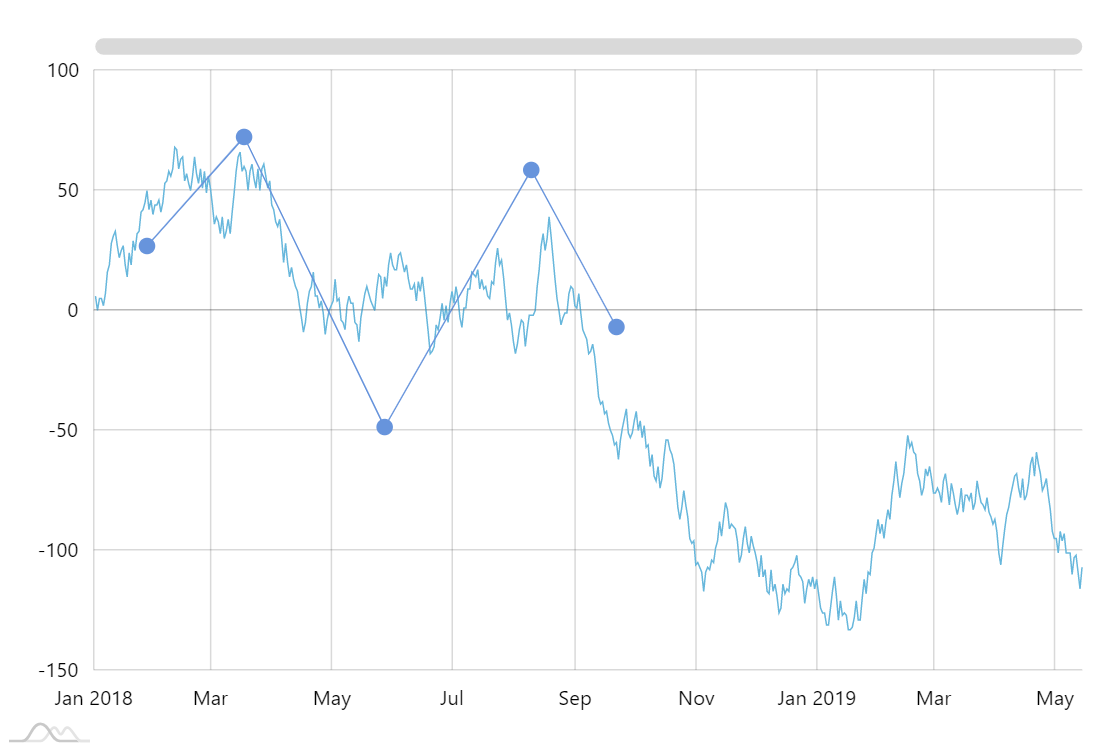
Your charts don’t have to be limited to passively displaying data. You can use amCharts as an interactive chart creation surface and enable your users to visually draw new charts. Click anywhere on plot area to draw the new series, drag bullets to adjust positions.
Demo source
<!-- Styles -->
<style>
#chartdiv {
  width: 100%;
  height: 500px;
}


.ampopup-content {
  background: rgb(60, 171, 255)!important;
  background-color: rgba(60, 171, 255, 0.8)!important;
}
</style>

<!-- Resources -->
<script src="https://cdn.amcharts.com/lib/4/core.js"></script>
<script src="https://cdn.amcharts.com/lib/4/charts.js"></script>
<script src="https://cdn.amcharts.com/lib/4/themes/animated.js"></script>

<!-- Chart code -->
<script>
am4core.ready(function() {

// Themes begin
am4core.useTheme(am4themes_animated);
// Themes end


var chart = am4core.create("chartdiv", am4charts.XYChart);
chart.paddingRight = 20;

var data = [];
var visits = 10;
for (var i = 1; i < 500; i++) {
  visits += Math.round((Math.random() < 0.5 ? 1 : -1) * Math.random() * 10);
  data.push({ date: new Date(2018, 0, i, 0,0,0,0), value: visits });
}

chart.data = data;

var popup = chart.openPopup("<div>Click on plot area to add points<br>Drag bullets to change values<br>Double click on bullet to remove</div>");
popup.top = 60;
popup.right = 30;
popup.defaultStyles = false;


var dateAxis = chart.xAxes.push(new am4charts.DateAxis());
dateAxis.renderer.grid.template.location = 0;
dateAxis.renderer.minGridDistance = 60;

var valueAxis = chart.yAxes.push(new am4charts.ValueAxis());
//valueAxis.tooltip.disabled = true;
valueAxis.renderer.minWidth = 35;

var series = chart.series.push(new am4charts.LineSeries());
series.dataFields.dateX = "date";
series.dataFields.valueY = "value";
//series.tooltipText = "{valueY}";
series.tooltip.pointerOrientation = "vertical";
series.tooltip.background.fillOpacity = 0.5;

chart.cursor = new am4charts.XYCursor();
chart.cursor.xAxis = dateAxis;
chart.cursor.behavior = "none";

var scrollbarX = new am4core.Scrollbar();
chart.scrollbarX = scrollbarX;

var newSeries;
var addingPointsDisabled = false;

addSeries();

function addSeries() {
  newSeries = chart.series.push(new am4charts.LineSeries())
  newSeries.data = []
  newSeries.dataFields.dateX = "date";
  newSeries.dataFields.valueY = "newValue";
  newSeries.interpolationDuration = 0;

  var bullet = newSeries.bullets.push(new am4charts.CircleBullet());
  bullet.draggable = true;

  bullet.events.on("dragged", function(event) {
    var bullet = event.target;

    var x = bullet.pixelX;
    //x = dateAxis.getX(bullet.dataItem, "dateX"); //  uncomment this line if you want to allow draggin bullets only along y axis

    bullet.moveTo({ x: x, y: bullet.pixelY }, undefined, undefined, true);
    bullet.dataItem.valueY = valueAxis.yToValue(bullet.pixelY);
    bullet.dataItem.dataContext.newValue = bullet.dataItem.valueY;

    // remove the following three lines if you want to allow draggin bullets only along y axis
    bullet.dataItem.dateX = dateAxis.xToValue(bullet.pixelX);
    bullet.dataItem.dataContext.date = bullet.dataItem.dateX;
    dateAxis.postProcessSeriesDataItem(bullet.dataItem);
  })

  bullet.events.on("down", function(event) {
    addingPointsDisabled = true;

    chart.cursor.triggerMove(
      { x: series.tooltipX, y: series.tooltipY },
      "hard"
    ); // sticks cursor to the point

  })


  bullet.events.on("dragstop", function(event) {

    var bullet = event.target;

    chart.cursor.triggerMove(
      { x: series.tooltipX, y: series.tooltipY },
      "none"
    ); // enables mouse following again

    addingPointsDisabled = false;
  })

  bullet.events.on("doublehit", function(event) {
    addingPointsDisabled = false;
    var dataItem = event.target.dataItem;
    var dataContext = dataItem.dataContext;
    newSeries.data.splice(newSeries.data.indexOf(dataContext), 1);
    newSeries.invalidateData();

    chart.cursor.triggerMove(
      { x: series.tooltipX, y: series.tooltipY },
      "none"
    ); // enables mouse following again
  })
}


var interaction = am4core.getInteraction();

interaction.events.on("up", function(event) {
  if (newSeries && !addingPointsDisabled && chart.cursor.visible) {
    var date = series.tooltipDataItem.dateX;
    var point = am4core.utils.documentPointToSprite(event.pointer.point, chart.seriesContainer);
    var value = valueAxis.yToValue(point.y);
    if (value > valueAxis.min && value < valueAxis.max) {
      newSeries.data.push({ date: date, newValue: value });
      sortData();
      newSeries.invalidateData();
    }
  }
})

function sortData() {
  newSeries.data.sort(function(a, b) {
    var atime = a.date.getTime();
    var btime = b.date.getTime();

    if (atime < btime) {
      return -1;
    }
    else if (atime == btime) {
      return 0;
    }
    else {
      return 1;
    }
  })
}

}); // end am4core.ready()
</script>

<!-- HTML -->
<div id="chartdiv"></div>