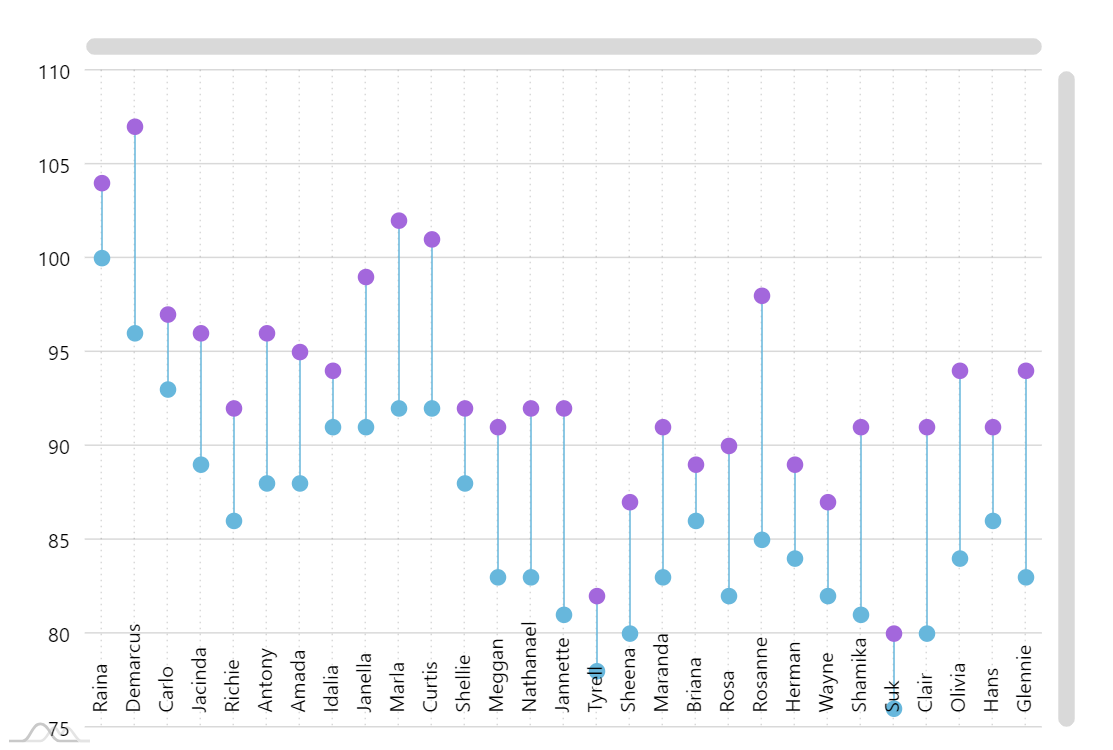
Dumbbell plot
Dumbbell plot (also known as Dumbbell chart, Connected dot plot) is great for displaying changes between two points in time, two conditions or differences between two groups.
See also: Horizontal dumbbell plot demo.
Demo source
<!-- Styles -->
<style>
#chartdiv {
  width: 100%;
  height: 500px;
}
</style>

<!-- Resources -->
<script src="https://cdn.amcharts.com/lib/4/core.js"></script>
<script src="https://cdn.amcharts.com/lib/4/charts.js"></script>
<script src="https://cdn.amcharts.com/lib/4/themes/animated.js"></script>

<!-- Chart code -->
<script>
am4core.ready(function() {

// Themes begin
am4core.useTheme(am4themes_animated);
// Themes end

var chart = am4core.create("chartdiv", am4charts.XYChart);

var data = [];
var open = 100;
var close = 120;

var names = ["Raina",
  "Demarcus",
  "Carlo",
  "Jacinda",
  "Richie",
  "Antony",
  "Amada",
  "Idalia",
  "Janella",
  "Marla",
  "Curtis",
  "Shellie",
  "Meggan",
  "Nathanael",
  "Jannette",
  "Tyrell",
  "Sheena",
  "Maranda",
  "Briana",
  "Rosa",
  "Rosanne",
  "Herman",
  "Wayne",
  "Shamika",
  "Suk",
  "Clair",
  "Olivia",
  "Hans",
  "Glennie",
];

for (var i = 0; i < names.length; i++) {
  open += Math.round((Math.random() < 0.5 ? 1 : -1) * Math.random() * 5);
  close = open + Math.round(Math.random() * 10) + 3;
  data.push({ category: names[i], open: open, close: close });
}

chart.data = data;
var categoryAxis = chart.xAxes.push(new am4charts.CategoryAxis());
categoryAxis.renderer.grid.template.location = 0;
categoryAxis.dataFields.category = "category";
categoryAxis.renderer.minGridDistance = 15;
categoryAxis.renderer.grid.template.location = 0.5;
categoryAxis.renderer.grid.template.strokeDasharray = "1,3";
categoryAxis.renderer.labels.template.rotation = -90;
categoryAxis.renderer.labels.template.horizontalCenter = "left";
categoryAxis.renderer.labels.template.location = 0.5;
categoryAxis.renderer.inside = true;

categoryAxis.renderer.labels.template.adapter.add("dx", function(dx, target) {
    return -target.maxRight / 2;
})

var valueAxis = chart.yAxes.push(new am4charts.ValueAxis());
valueAxis.tooltip.disabled = true;
valueAxis.renderer.ticks.template.disabled = true;
valueAxis.renderer.axisFills.template.disabled = true;

var series = chart.series.push(new am4charts.ColumnSeries());
series.dataFields.categoryX = "category";
series.dataFields.openValueY = "open";
series.dataFields.valueY = "close";
series.tooltipText = "open: {openValueY.value} close: {valueY.value}";
series.sequencedInterpolation = true;
series.fillOpacity = 0;
series.strokeOpacity = 1;
series.columns.template.width = 0.01;
series.tooltip.pointerOrientation = "horizontal";

var openBullet = series.bullets.create(am4charts.CircleBullet);
openBullet.locationY = 1;

var closeBullet = series.bullets.create(am4charts.CircleBullet);

closeBullet.fill = chart.colors.getIndex(4);
closeBullet.stroke = closeBullet.fill;

chart.cursor = new am4charts.XYCursor();

chart.scrollbarX = new am4core.Scrollbar();
chart.scrollbarY = new am4core.Scrollbar();


}); // end am4core.ready()
</script>

<!-- HTML -->
<div id="chartdiv"></div> 