<!-- Styles --><style>#chartdiv {
width: 100%;
height: 500px;
}
</style><!-- Resources --><scriptsrc="https://cdn.amcharts.com/lib/4/core.js"></script><scriptsrc="https://cdn.amcharts.com/lib/4/charts.js"></script><scriptsrc="https://cdn.amcharts.com/lib/4/themes/animated.js"></script><!-- Chart code --><script>
am4core.ready(function() {
// Themes begin
am4core.useTheme(am4themes_animated);
// Themes endvar chart = am4core.create("chartdiv", am4charts.XYChart);
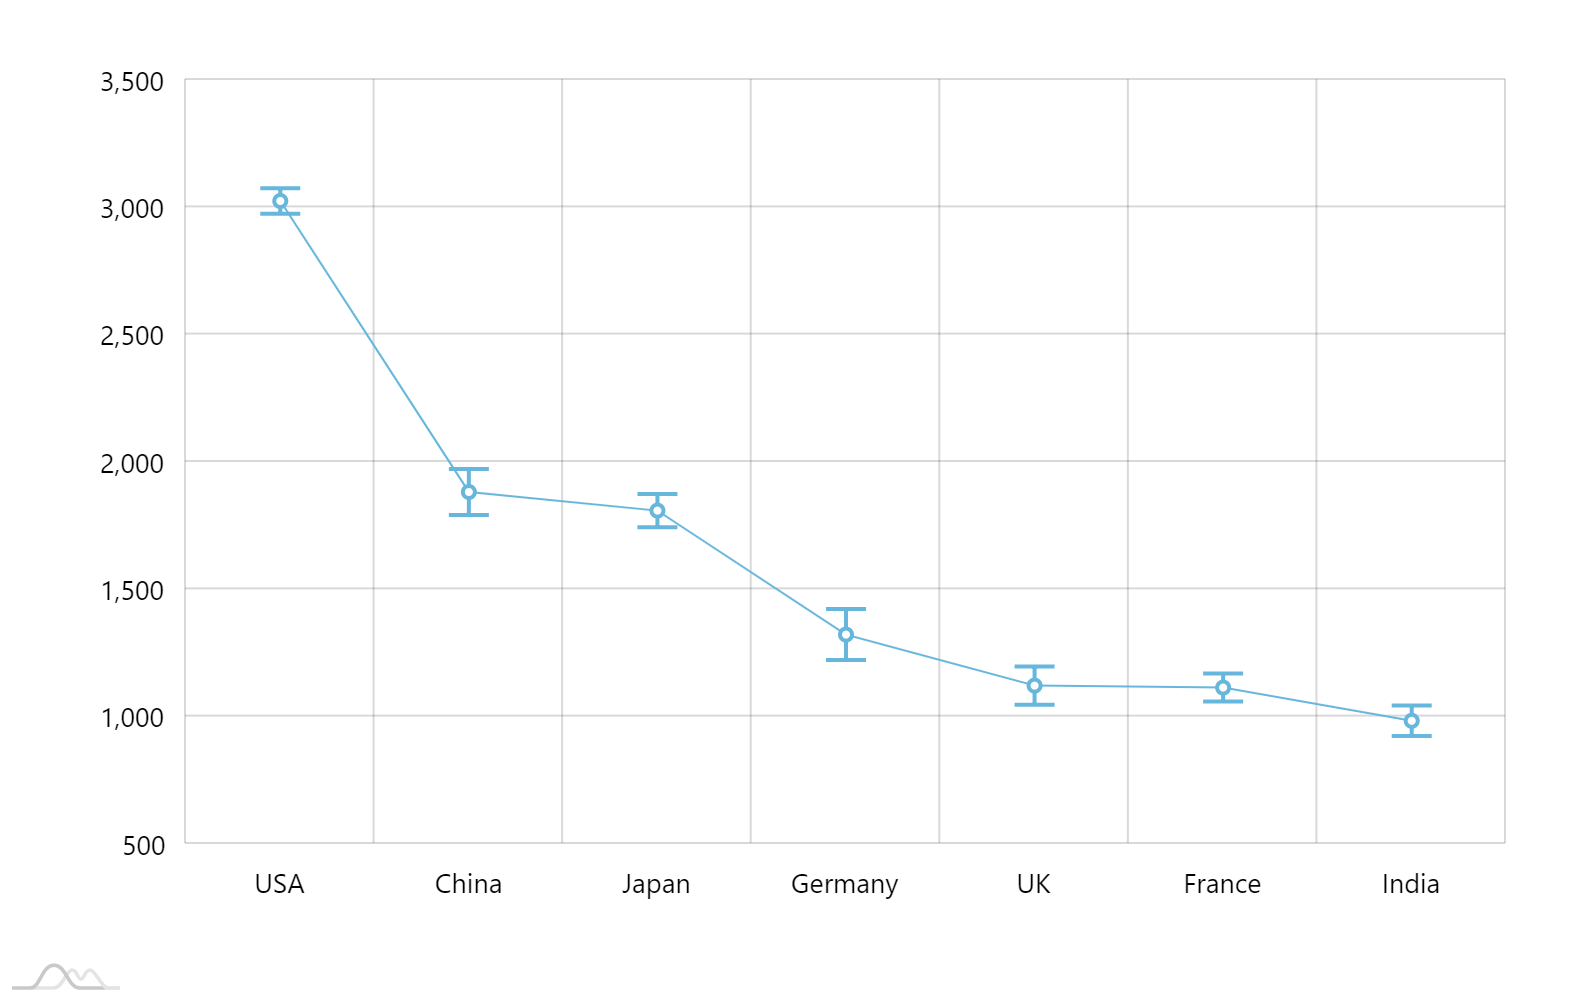
chart.data = [{
"country": "USA",
"visits": 3025,
"error":100
}, {
"country": "China",
"visits": 1882,
"error":180
}, {
"country": "Japan",
"visits": 1809,
"error":130
}, {
"country": "Germany",
"visits": 1322,
"error":200
}, {
"country": "UK",
"visits": 1122,
"error":150
}, {
"country": "France",
"visits": 1114,
"error":110
}, {
"country": "India",
"visits": 984,
"error":120
}];
chart.padding(40, 40, 40, 40);
var categoryAxis = chart.xAxes.push(new am4charts.CategoryAxis());
categoryAxis.renderer.grid.template.location = 0;
categoryAxis.dataFields.category = "country";
categoryAxis.renderer.minGridDistance = 60;
var valueAxis = chart.yAxes.push(new am4charts.ValueAxis());
var series = chart.series.push(new am4charts.LineSeries());
series.dataFields.categoryX = "country";
series.dataFields.valueY = "visits";
series.tooltipText = "{valueY.value} error:{error}"var errorBullet = series.bullets.create(am4charts.ErrorBullet);
errorBullet.isDynamic = true;
errorBullet.strokeWidth = 2;
var circle = errorBullet.createChild(am4core.Circle);
circle.radius = 3;
circle.fill = am4core.color("#ffffff");
// adapter adjusts height of a bullet
errorBullet.adapter.add("pixelHeight", function (pixelHeight, target) {
var dataItem = target.dataItem;
if(dataItem){
var value = dataItem.valueY;
var errorTopValue = value + dataItem.dataContext.error / 2;
var errorTopY = valueAxis.valueToPoint(errorTopValue).y;
var errorBottomValue = value - dataItem.dataContext.error / 2;
var errorBottomY = valueAxis.valueToPoint(errorBottomValue).y;
returnMath.abs(errorTopY - errorBottomY);
}
return pixelHeight;
})
chart.cursor = new am4charts.XYCursor();
}); // end am4core.ready()</script><!-- HTML --><divid="chartdiv"></div>
/* Imports */import * as am4core from"@amcharts/amcharts4/core";
import * as am4charts from"@amcharts/amcharts4/charts";
import am4themes_animated from"@amcharts/amcharts4/themes/animated";
/* Chart code */// Themes begin
am4core.useTheme(am4themes_animated);
// Themes endlet chart = am4core.create("chartdiv", am4charts.XYChart);
chart.data = [{
"country": "USA",
"visits": 3025,
"error":100
}, {
"country": "China",
"visits": 1882,
"error":180
}, {
"country": "Japan",
"visits": 1809,
"error":130
}, {
"country": "Germany",
"visits": 1322,
"error":200
}, {
"country": "UK",
"visits": 1122,
"error":150
}, {
"country": "France",
"visits": 1114,
"error":110
}, {
"country": "India",
"visits": 984,
"error":120
}];
chart.padding(40, 40, 40, 40);
let categoryAxis = chart.xAxes.push(new am4charts.CategoryAxis());
categoryAxis.renderer.grid.template.location = 0;
categoryAxis.dataFields.category = "country";
categoryAxis.renderer.minGridDistance = 60;
let valueAxis = chart.yAxes.push(new am4charts.ValueAxis());
let series = chart.series.push(new am4charts.LineSeries());
series.dataFields.categoryX = "country";
series.dataFields.valueY = "visits";
series.tooltipText = "{valueY.value} error:{error}"let errorBullet = series.bullets.create(am4charts.ErrorBullet);
errorBullet.isDynamic = true;
errorBullet.strokeWidth = 2;
let circle = errorBullet.createChild(am4core.Circle);
circle.radius = 3;
circle.fill = am4core.color("#ffffff");
// adapter adjusts height of a bullet
errorBullet.adapter.add("pixelHeight", function (pixelHeight, target) {
let dataItem = target.dataItem;
if(dataItem){
let value = dataItem.valueY;
let errorTopValue = value + dataItem.dataContext.error / 2;
let errorTopY = valueAxis.valueToPoint(errorTopValue).y;
let errorBottomValue = value - dataItem.dataContext.error / 2;
let errorBottomY = valueAxis.valueToPoint(errorBottomValue).y;
returnMath.abs(errorTopY - errorBottomY);
}
return pixelHeight;
})
chart.cursor = new am4charts.XYCursor();
We use cookies on our website to support technical features that enhance your user experience. We also collect anonymous analytical data, as described in our Privacy policy.
Attention, please!
We use cookies for essential website functionality, analytics, and ad performance measurement as per our Privacy Policy.