Exporting chart to image
Built-in export
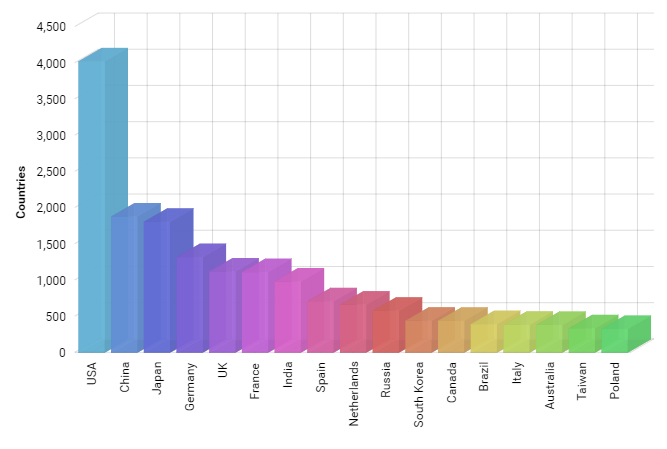
amCharts 4 has image and data exporting functionality built-in. Just enabled export menu and you’re all set.
You can export charts to most popular image and vector formats like PNG, JPEG, or SVG, as well as PDF. Data can be exported as CSV, JSON, or XLSX.
Demo source
<!-- Styles -->
<style>
#chartdiv {
  width: 100%;
  height: 500px;
}

</style>

<!-- Resources -->
<script src="https://cdn.amcharts.com/lib/4/core.js"></script>
<script src="https://cdn.amcharts.com/lib/4/charts.js"></script>
<script src="https://cdn.amcharts.com/lib/4/themes/animated.js"></script>

<!-- Chart code -->
<script>
am4core.ready(function() {

// Themes begin
am4core.useTheme(am4themes_animated);
// Themes end

// Create chart instance
var chart = am4core.create("chartdiv", am4charts.XYChart3D);

// Add data
chart.data = [{
  "country": "USA",
  "visits": 4025,
  "color": chart.colors.next()
}, {
  "country": "China",
  "visits": 1882,
  "color": chart.colors.next()
}, {
  "country": "Japan",
  "visits": 1809,
  "color": chart.colors.next()
}, {
  "country": "Germany",
  "visits": 1322,
  "color": chart.colors.next()
}, {
  "country": "UK",
  "visits": 1122,
  "color": chart.colors.next()
}, {
  "country": "France",
  "visits": 1114,
  "color": chart.colors.next()
}, {
  "country": "India",
  "visits": 984,
  "color": chart.colors.next()
}, {
  "country": "Spain",
  "visits": 711,
  "color": chart.colors.next()
}, {
  "country": "Netherlands",
  "visits": 665,
  "color": chart.colors.next()
}, {
  "country": "Russia",
  "visits": 580,
  "color": chart.colors.next()
}, {
  "country": "South Korea",
  "visits": 443,
  "color": chart.colors.next()
}, {
  "country": "Canada",
  "visits": 441,
  "color": chart.colors.next()
}, {
  "country": "Brazil",
  "visits": 395,
  "color": chart.colors.next()
}, {
  "country": "Italy",
  "visits": 386,
  "color": chart.colors.next()
}, {
  "country": "Australia",
  "visits": 384,
  "color": chart.colors.next()
}, {
  "country": "Taiwan",
  "visits": 338,
  "color": chart.colors.next()
}, {
  "country": "Poland",
  "visits": 328,
  "color": chart.colors.next()
}];

// Create axes
var categoryAxis = chart.xAxes.push(new am4charts.CategoryAxis());
categoryAxis.dataFields.category = "country";
categoryAxis.renderer.labels.template.rotation = 270;
categoryAxis.renderer.labels.template.hideOversized = false;
categoryAxis.renderer.minGridDistance = 20;
categoryAxis.renderer.labels.template.horizontalCenter = "right";
categoryAxis.renderer.labels.template.verticalCenter = "middle";
categoryAxis.tooltip.label.rotation = 270;
categoryAxis.tooltip.label.horizontalCenter = "right";
categoryAxis.tooltip.label.verticalCenter = "middle";

var valueAxis = chart.yAxes.push(new am4charts.ValueAxis());
valueAxis.title.text = "Countries";
valueAxis.title.fontWeight = "bold";

// Create series
var series = chart.series.push(new am4charts.ColumnSeries3D());
series.dataFields.valueY = "visits";
series.dataFields.categoryX = "country";
series.name = "Visits";
series.tooltipText = "{categoryX}: [bold]{valueY}[/]";
series.columns.template.fillOpacity = .8;
series.columns.template.propertyFields.fill = "color";

var columnTemplate = series.columns.template;
columnTemplate.strokeWidth = 2;
columnTemplate.strokeOpacity = 1;
columnTemplate.stroke = am4core.color("#FFFFFF");

chart.cursor = new am4charts.XYCursor();
chart.cursor.lineX.strokeOpacity = 0;
chart.cursor.lineY.strokeOpacity = 0;

// Enable export
chart.exporting.menu = new am4core.ExportMenu();

}); // end am4core.ready()
</script>

<!-- HTML -->
<div id="chartdiv"></div>