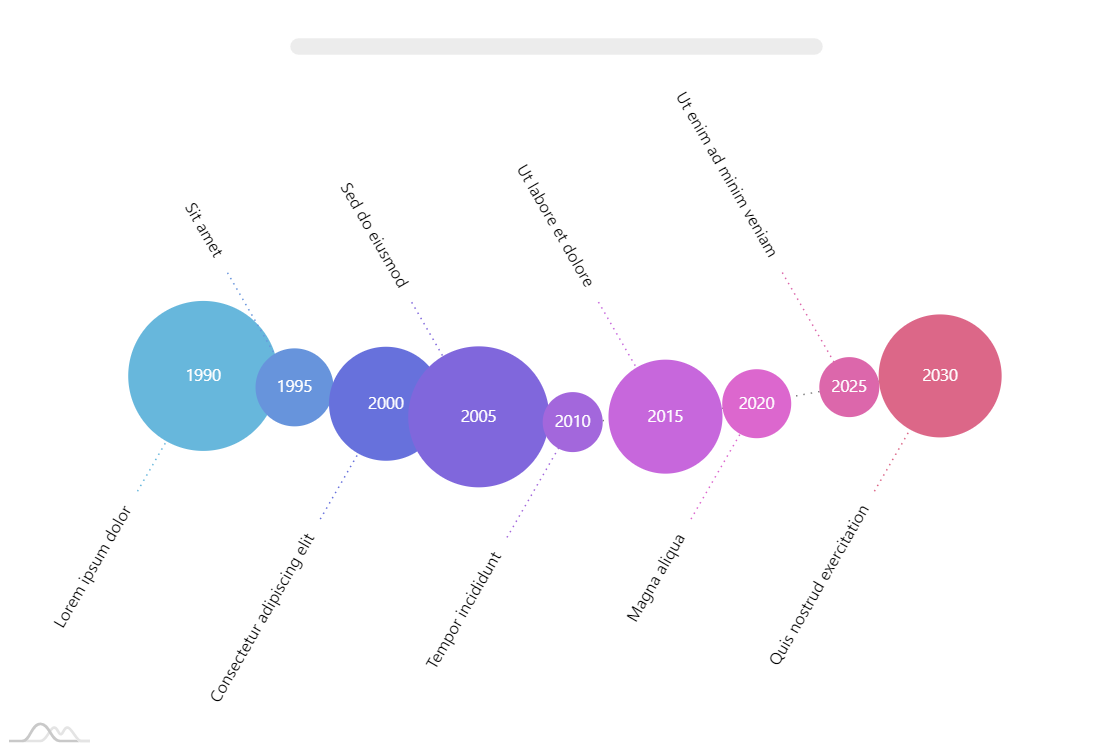
Fishbone timeline
Fishbone timeline (also known as Fishbone diagram, Ishikawa diagram, herringbone diagrams, cause-and-effect diagrams, or Fishikawa) is generally used to show the causes of a specific event. Fishbone diagrams are commonly used in product design, defect detection and prevention, and displaying factors causing a specific effect.
This demo uses amCharts 4 TimeLine add-on.
Demo source
<!-- Styles -->
<style>
#chartdiv {
  width: 100%;
  height: 600px;
}
</style>

<!-- Resources -->
<script src="https://cdn.amcharts.com/lib/4/core.js"></script>
<script src="https://cdn.amcharts.com/lib/4/charts.js"></script>
<script src="https://cdn.amcharts.com/lib/4/plugins/timeline.js"></script>
<script src="https://cdn.amcharts.com/lib/4/themes/animated.js"></script>

<!-- Chart code -->
<script>
am4core.ready(function() {

// Themes begin
am4core.useTheme(am4themes_animated);
// Themes end

var chart = am4core.create("chartdiv", am4plugins_timeline.CurveChart);
chart.curveContainer.padding(0, 100, 0, 120);
chart.maskBullets = false;

var colorSet = new am4core.ColorSet();

chart.data = [{
    "category": "",
    "year": "1990",
    "size": 13,
    "text": "Lorem ipsum dolor"
  }, {
    "category": "",
    "year": "1995",
    "size": 5,
    "text": "Sit amet"
  }, {
    "category": "",
    "year": "2000",
    "size": 9,
    "text": "Consectetur adipiscing elit"
  }, {
    "category": "",
    "year": "2005",
    "size": 12,
    "text": "Sed do eiusmod"
  }, {
    "category": "",
    "year": "2010",
    "size": 3,
    "text": "Tempor incididunt"
  }, {
    "category": "",
    "year": "2015",
    "size": 9,
    "text": "Ut labore et dolore"
  }, {
    "category": "",
    "year": "2020",
    "size": 4,
    "text": "Magna aliqua"
  }, {
    "category": "",
    "year": "2025",
    "size": 3,
    "text": "Ut enim ad minim veniam"
  }, {
    "category": "",
    "size": 10,
    "year": "2030",
    "text": "Quis nostrud exercitation"
  }
];

chart.dateFormatter.inputDateFormat = "yyyy";

chart.fontSize = 11;
chart.tooltipContainer.fontSize = 11;

var categoryAxis = chart.yAxes.push(new am4charts.CategoryAxis());
categoryAxis.dataFields.category = "category";
categoryAxis.renderer.grid.template.disabled = true;

var dateAxis = chart.xAxes.push(new am4charts.DateAxis());
dateAxis.renderer.points = [{ x: -400, y: 0 }, { x: 0, y: 50 }, { x: 400, y: 0 }]
dateAxis.renderer.polyspline.tensionX = 0.8;
dateAxis.renderer.grid.template.disabled = true;
dateAxis.renderer.line.strokeDasharray = "1,4";
dateAxis.baseInterval = {period:"day", count:1}; // otherwise initial animation will be not smooth

dateAxis.renderer.labels.template.disabled = true;

var series = chart.series.push(new am4plugins_timeline.CurveLineSeries());
series.strokeOpacity = 0;
series.dataFields.dateX = "year";
series.dataFields.categoryY = "category";
series.dataFields.value = "size";
series.baseAxis = categoryAxis;

var interfaceColors = new am4core.InterfaceColorSet();

series.tooltip.pointerOrientation = "down";

var distance = 100;
var angle = 60;

var bullet = series.bullets.push(new am4charts.Bullet());

var line = bullet.createChild(am4core.Line);
line.adapter.add("stroke", function(fill, target) {
  if (target.dataItem) {
    return chart.colors.getIndex(target.dataItem.index)
  }
});

line.x1 = 0;
line.y1 = 0;
line.y2 = 0;
line.x2 = distance - 10;
line.strokeDasharray = "1,3";

var circle = bullet.createChild(am4core.Circle);
circle.radius = 30;
circle.fillOpacity = 1;
circle.strokeOpacity = 0;

var circleHoverState = circle.states.create("hover");
circleHoverState.properties.scale = 1.3;

series.heatRules.push({ target: circle, min: 20, max: 50, property: "radius" });
circle.adapter.add("fill", function(fill, target) {
  if (target.dataItem) {
    return chart.colors.getIndex(target.dataItem.index)
  }
});
circle.tooltipText = "{text}: {value}";
circle.adapter.add("tooltipY", function(tooltipY, target){
  return -target.pixelRadius - 4;
});

var yearLabel = bullet.createChild(am4core.Label);
yearLabel.text = "{year}";
yearLabel.strokeOpacity = 0;
yearLabel.fill = am4core.color("#fff");
yearLabel.horizontalCenter = "middle";
yearLabel.verticalCenter = "middle";
yearLabel.interactionsEnabled = false;

var label = bullet.createChild(am4core.Label);
label.propertyFields.text = "text";
label.strokeOpacity = 0;
label.horizontalCenter = "right";
label.verticalCenter = "middle";

label.adapter.add("opacity", function(opacity, target) {
  if(target.dataItem){
    var index = target.dataItem.index;
    var line = target.parent.children.getIndex(0);

    if (index % 2 == 0) {
      target.y = -distance * am4core.math.sin(-angle);
      target.x = -distance * am4core.math.cos(-angle);
      line.rotation = -angle - 180;
      target.rotation = -angle;
    }
    else {
      target.y = -distance * am4core.math.sin(angle);
      target.x = -distance * am4core.math.cos(angle);
      line.rotation = angle - 180;
      target.rotation = angle;
    }
  }
  return 1;
});

var outerCircle = bullet.createChild(am4core.Circle);
outerCircle.radius = 30;
outerCircle.fillOpacity = 0;
outerCircle.strokeOpacity = 0;
outerCircle.strokeDasharray = "1,3";

var hoverState = outerCircle.states.create("hover");
hoverState.properties.strokeOpacity = 0.8;
hoverState.properties.scale = 1.5;

outerCircle.events.on("over", function(event){
  var circle = event.target.parent.children.getIndex(1);
  circle.isHover = true;
  event.target.stroke = circle.fill;
  event.target.radius = circle.pixelRadius;
  event.target.animate({property: "rotation", from: 0, to: 360}, 4000, am4core.ease.sinInOut);
});

outerCircle.events.on("out", function(event){
  var circle = event.target.parent.children.getIndex(1);
  circle.isHover = false;
});

chart.scrollbarX = new am4core.Scrollbar();
chart.scrollbarX.opacity = 0.5;
chart.scrollbarX.width = am4core.percent(50);
chart.scrollbarX.align = "center";

}); // end am4core.ready()
</script>

<!-- HTML -->
<div id="chartdiv"></div>