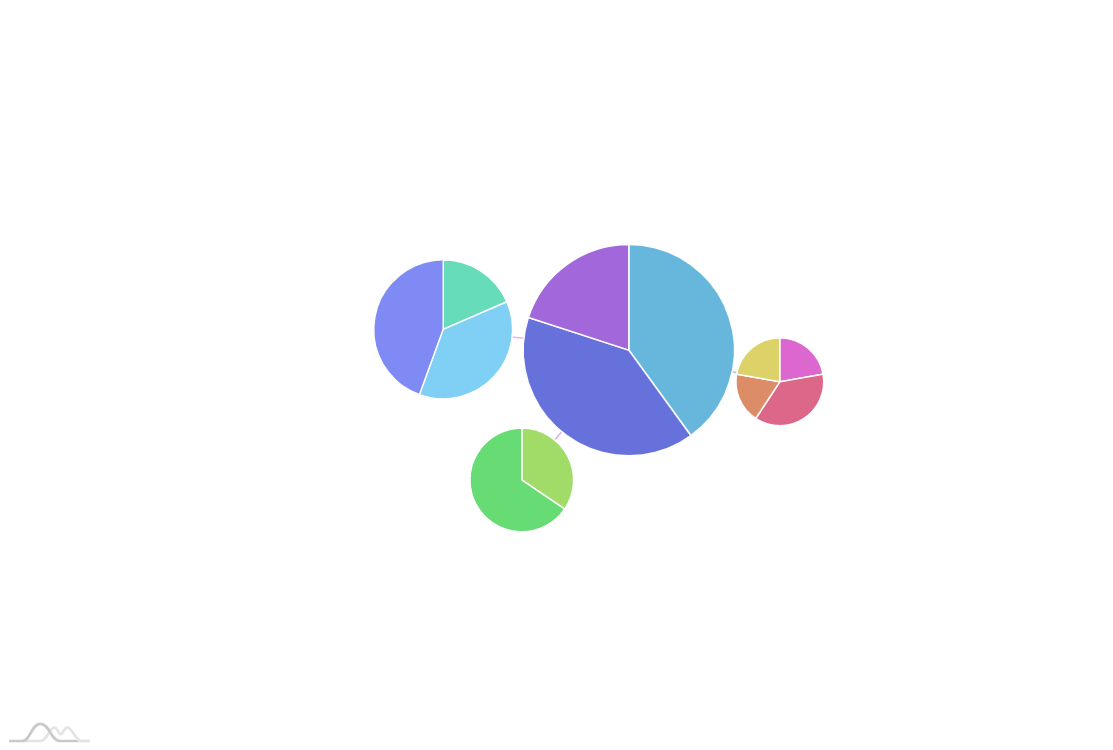
Force-directed with Pie charts
This demo shows how you can replace regular nodes of a ForceDirectedTree chart with a live Pie charts.
Demo source
<!-- Styles -->
<style>
#chartdiv {
  width: 100%;
  height: 550px;
}
</style>

<!-- Resources -->
<script src="https://cdn.amcharts.com/lib/4/core.js"></script>
<script src="https://cdn.amcharts.com/lib/4/charts.js"></script>
<script src="https://cdn.amcharts.com/lib/4/plugins/forceDirected.js"></script>
<script src="https://cdn.amcharts.com/lib/4/themes/animated.js"></script>

<!-- Chart code -->
<script>
am4core.ready(function() {

// Themes begin
am4core.useTheme(am4themes_animated);
// Themes end

var chart = am4core.create("chartdiv", am4plugins_forceDirected.ForceDirectedTree);
var networkSeries = chart.series.push(new am4plugins_forceDirected.ForceDirectedSeries())

chart.data = [
  {
    name: "Core",
    pie: [{
      category: "Cat #1",
      value: 100
    }, {
      category: "Cat #2",
      value: 100
    }, {
      category: "Cat #3",
      value: 50
    }],
    children: [
      {
        name: "First",
        value: 160,
        pie: [{
          category: "Cat #1",
          value: 60
        }, {
          category: "Cat #2",
          value: 100
        }, {
          category: "Cat #3",
          value: 50
        }, {
          category: "Cat #4",
          value: 60
        }]
      },
      {
        name: "Second",
        value: 250,
        pie: [{
          category: "Cat #1",
          value: 100
        }, {
          category: "Cat #2",
          value: 190
        }]
      },
      {
        name: "Third",
        value: 450,
        pie: [{
          category: "Cat #1",
          value: 50
        }, {
          category: "Cat #2",
          value: 100
        }, {
          category: "Cat #3",
          value: 120
        }]
      }

    ]
  }
];

networkSeries.dataFields.value = "value";
networkSeries.dataFields.name = "name";
networkSeries.dataFields.children = "children";
networkSeries.manyBodyStrength = -20;
networkSeries.links.template.strength = 0.8;
networkSeries.minRadius = am4core.percent(2);

networkSeries.nodes.template.label.text = "{name}"
networkSeries.fontSize = 10;

networkSeries.nodes.template.label.disabled = true;
networkSeries.nodes.template.circle.fillOpacity = 0.2;
networkSeries.nodes.template.outerCircle.disabled = true;
networkSeries.nodes.template.layout = "absolute";
networkSeries.nodes.template.togglable = false;

var pieChart = networkSeries.nodes.template.createChild(am4charts.PieChart);
pieChart.isMeasured = false;
pieChart.propertyFields.data = "pie";
pieChart.horizontalCenter = "middle";
pieChart.verticalCenter = "middle";
pieChart.chartContainer.minWidth = undefined;
pieChart.chartContainer.minHeight = undefined;


pieChart.adapter.add("radius", function(radius, target) {
	var radius = target.parent.outerCircle.pixelRadius;
 	target.width = radius * 2;
	target.height = radius * 2;

	target.chartContainer.minWidth = undefined;
	target.chartContainer.minHeight = undefined;

  	return radius;
});

chart.events.on("maxsizechanged", function(){
	pieChart.clones.each(function(clone){
		clone.radius = clone.radius;
	})
})

var pieSeries = pieChart.series.push(new am4charts.PieSeries());
pieSeries.dataFields.category = "category";
pieSeries.dataFields.value = "value";
pieSeries.labels.template.disabled = true;
pieSeries.ticks.template.disabled = true;
pieSeries.slices.template.stroke = am4core.color("#fff");
pieSeries.slices.template.strokeWidth = 1;

}); // end am4core.ready()
</script>

<!-- HTML -->
<div id="chartdiv"></div>