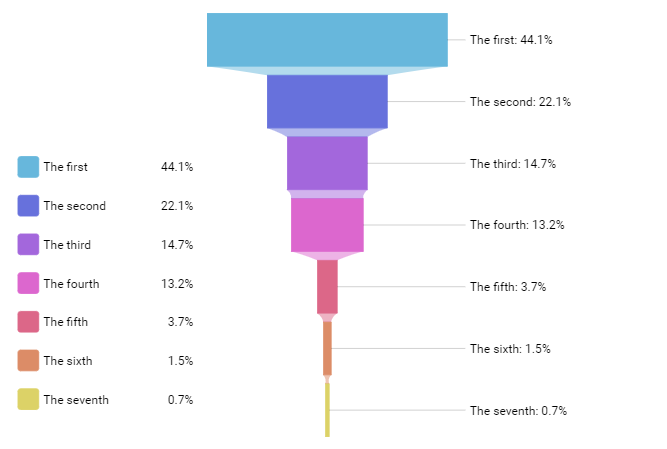
Funnel Chart is used to display how the data is filtered down through the steps of some process or processes. Each step represents a portion of the total going through it. The top (head) of each step represents the incoming value and the bottom (neck) the output value after some sort of filtering.
Demo source
<!-- Styles --><style>#chartdiv {
width: 100%;
height: 500px;
}
</style><!-- Resources --><scriptsrc="https://cdn.amcharts.com/lib/4/core.js"></script><scriptsrc="https://cdn.amcharts.com/lib/4/charts.js"></script><scriptsrc="https://cdn.amcharts.com/lib/4/themes/animated.js"></script><!-- Chart code --><script>
am4core.ready(function() {
// Themes begin
am4core.useTheme(am4themes_animated);
// Themes endvar chart = am4core.create("chartdiv", am4charts.SlicedChart);
chart.hiddenState.properties.opacity = 0; // this makes initial fade in effect
chart.data = [{
"name": "The first",
"value": 600
}, {
"name": "The second",
"value": 300
}, {
"name": "The third",
"value": 200
}, {
"name": "The fourth",
"value": 180
}, {
"name": "The fifth",
"value": 50
}, {
"name": "The sixth",
"value": 20
}, {
"name": "The seventh",
"value": 10
}];
var series = chart.series.push(new am4charts.FunnelSeries());
series.colors.step = 2;
series.dataFields.value = "value";
series.dataFields.category = "name";
series.alignLabels = true;
series.labelsContainer.paddingLeft = 15;
series.labelsContainer.width = 200;
//series.orientation = "horizontal";//series.bottomRatio = 1;
chart.legend = new am4charts.Legend();
chart.legend.position = "left";
chart.legend.valign = "bottom";
chart.legend.margin(5,5,20,5);
}); // end am4core.ready()</script><!-- HTML --><divid="chartdiv"></div>
/* Imports */import * as am4core from"@amcharts/amcharts4/core";
import * as am4charts from"@amcharts/amcharts4/charts";
import am4themes_animated from"@amcharts/amcharts4/themes/animated";
/* Chart code */// Themes begin
am4core.useTheme(am4themes_animated);
// Themes endlet chart = am4core.create("chartdiv", am4charts.SlicedChart);
chart.hiddenState.properties.opacity = 0; // this makes initial fade in effect
chart.data = [{
"name": "The first",
"value": 600
}, {
"name": "The second",
"value": 300
}, {
"name": "The third",
"value": 200
}, {
"name": "The fourth",
"value": 180
}, {
"name": "The fifth",
"value": 50
}, {
"name": "The sixth",
"value": 20
}, {
"name": "The seventh",
"value": 10
}];
let series = chart.series.push(new am4charts.FunnelSeries());
series.colors.step = 2;
series.dataFields.value = "value";
series.dataFields.category = "name";
series.alignLabels = true;
series.labelsContainer.paddingLeft = 15;
series.labelsContainer.width = 200;
//series.orientation = "horizontal";//series.bottomRatio = 1;
chart.legend = new am4charts.Legend();
chart.legend.position = "left";
chart.legend.valign = "bottom";
chart.legend.margin(5,5,20,5);
We use cookies on our website to support technical features that enhance your user experience. We also collect anonymous analytical data, as described in our Privacy policy.
Attention, please!
We use cookies for essential website functionality, analytics, and ad performance measurement as per our Privacy Policy.