JavaScript TypeScript / ES6 ...
<style >
#chartdiv {
width : 100% ;
height : 500px ;
}
</style >
<script src ="https://cdn.amcharts.com/lib/4/core.js" > </script >
<script src ="https://cdn.amcharts.com/lib/4/charts.js" > </script >
<script src ="https://cdn.amcharts.com/lib/4/themes/animated.js" > </script >
<script >
am4core.ready (function (useTheme (am4themes_animated);
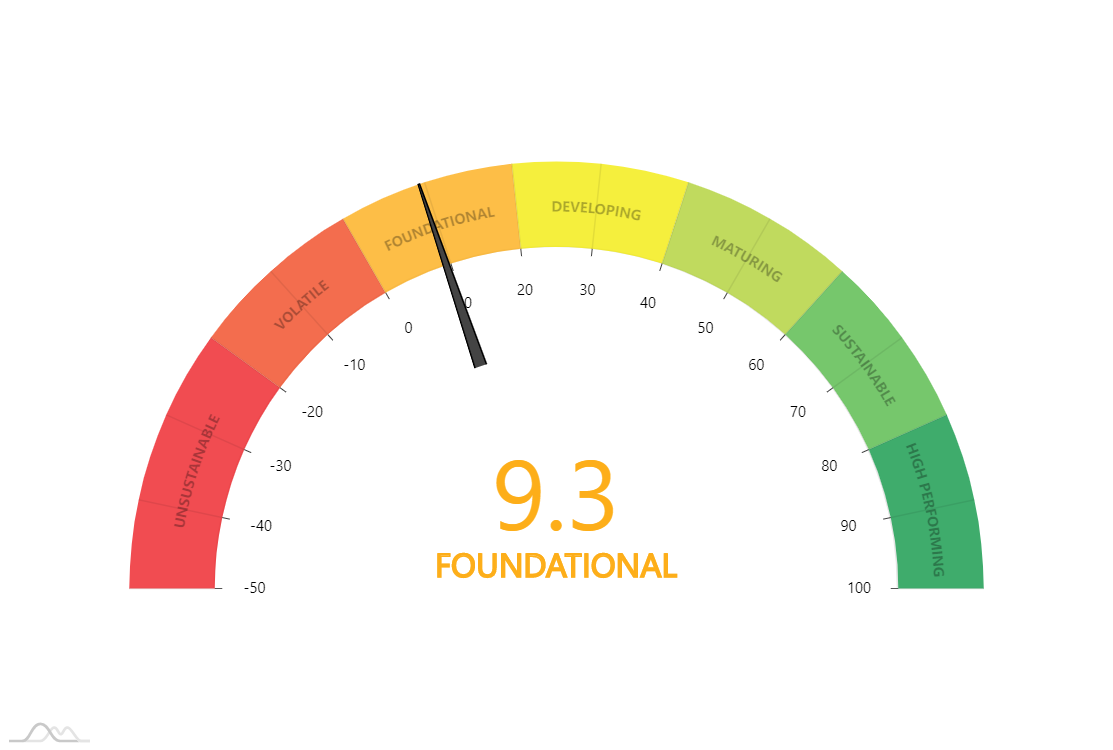
var chartMin = -50 ;
var chartMax = 100 ;
var data = {
score : 52.7 ,
gradingData : [
{
title : "Unsustainable" ,
color : "#ee1f25" ,
lowScore : -100 ,
highScore : -20
},
{
title : "Volatile" ,
color : "#f04922" ,
lowScore : -20 ,
highScore : 0
},
{
title : "Foundational" ,
color : "#fdae19" ,
lowScore : 0 ,
highScore : 20
},
{
title : "Developing" ,
color : "#f3eb0c" ,
lowScore : 20 ,
highScore : 40
},
{
title : "Maturing" ,
color : "#b0d136" ,
lowScore : 40 ,
highScore : 60
},
{
title : "Sustainable" ,
color : "#54b947" ,
lowScore : 60 ,
highScore : 80
},
{
title : "High Performing" ,
color : "#0f9747" ,
lowScore : 80 ,
highScore : 100
}
]
};
function lookUpGrade (lookupScore, grades ) {
for (var i = 0 ; i < grades.length ; i++) {
if (
grades[i].lowScore < lookupScore &&
grades[i].highScore >= lookupScore
) {
return grades[i];
}
}
return null ;
}
var chart = am4core.create ("chartdiv" , am4charts.GaugeChart );
chart.hiddenState .properties .opacity = 0 ;
chart.fontSize = 11 ;
chart.innerRadius = am4core.percent (80 );
chart.resizable = true ;
var axis = chart.xAxes .push (new am4charts.ValueAxis ());
axis.min = chartMin;
axis.max = chartMax;
axis.strictMinMax = true ;
axis.renderer .radius = am4core.percent (80 );
axis.renderer .inside = true ;
axis.renderer .line .strokeOpacity = 0.1 ;
axis.renderer .ticks .template .disabled = false ;
axis.renderer .ticks .template .strokeOpacity = 1 ;
axis.renderer .ticks .template .strokeWidth = 0.5 ;
axis.renderer .ticks .template .length = 5 ;
axis.renderer .grid .template .disabled = true ;
axis.renderer .labels .template .radius = am4core.percent (15 );
axis.renderer .labels .template .fontSize = "0.9em" ;
var axis2 = chart.xAxes .push (new am4charts.ValueAxis ());
axis2.min = chartMin;
axis2.max = chartMax;
axis2.strictMinMax = true ;
axis2.renderer .labels .template .disabled = true ;
axis2.renderer .ticks .template .disabled = true ;
axis2.renderer .grid .template .disabled = false ;
axis2.renderer .grid .template .opacity = 0.5 ;
axis2.renderer .labels .template .bent = true ;
axis2.renderer .labels .template .fill = am4core.color ("#000" );
axis2.renderer .labels .template .fontWeight = "bold" ;
axis2.renderer .labels .template .fillOpacity = 0.3 ;
for (let grading of data.gradingData ) {
var range = axis2.axisRanges .create ();
range.axisFill .fill = am4core.color (grading.color );
range.axisFill .fillOpacity = 0.8 ;
range.axisFill .zIndex = -1 ;
range.value = grading.lowScore > chartMin ? grading.lowScore : chartMin;
range.endValue = grading.highScore < chartMax ? grading.highScore : chartMax;
range.grid .strokeOpacity = 0 ;
range.stroke = am4core.color (grading.color ).lighten (-0.1 );
range.label .inside = true ;
range.label .text = grading.title .toUpperCase ();
range.label .inside = true ;
range.label .location = 0.5 ;
range.label .inside = true ;
range.label .radius = am4core.percent (10 );
range.label .paddingBottom = -5 ;
range.label .fontSize = "0.9em" ;
}
var matchingGrade = lookUpGrade (data.score , data.gradingData );
var label = chart.radarContainer .createChild (am4core.Label );
label.isMeasured = false ;
label.fontSize = "6em" ;
label.x = am4core.percent (50 );
label.paddingBottom = 15 ;
label.horizontalCenter = "middle" ;
label.verticalCenter = "bottom" ;
label.text = data.score .toFixed (1 );
label.fill = am4core.color (matchingGrade.color );
var label2 = chart.radarContainer .createChild (am4core.Label );
label2.isMeasured = false ;
label2.fontSize = "2em" ;
label2.horizontalCenter = "middle" ;
label2.verticalCenter = "bottom" ;
label2.text = matchingGrade.title .toUpperCase ();
label2.fill = am4core.color (matchingGrade.color );
var hand = chart.hands .push (new am4charts.ClockHand ());
hand.axis = axis2;
hand.innerRadius = am4core.percent (55 );
hand.startWidth = 8 ;
hand.pin .disabled = true ;
hand.value = data.score ;
hand.fill = am4core.color ("#444" );
hand.stroke = am4core.color ("#000" );
hand.events .on ("positionchanged" , function (text = axis2.positionToValue (hand.currentPosition ).toFixed (1 );
var value2 = axis.positionToValue (hand.currentPosition );
var matchingGrade = lookUpGrade (axis.positionToValue (hand.currentPosition ), data.gradingData );
label2.text = matchingGrade.title .toUpperCase ();
label2.fill = am4core.color (matchingGrade.color );
label2.stroke = am4core.color (matchingGrade.color );
label.fill = am4core.color (matchingGrade.color );
})
setInterval (function (var value = chartMin + Math .random () * (chartMax - chartMin);
hand.showValue (value, 1000 , am4core.ease .cubicOut );
}, 2000 );
});
</script >
<div id ="chartdiv" > </div >
import * as am4core from "@amcharts/amcharts4/core" ;
import * as am4charts from "@amcharts/amcharts4/charts" ;
import am4themes_animated from "@amcharts/amcharts4/themes/animated" ;
am4core.useTheme (am4themes_animated);
let chartMin = -50 ;
let chartMax = 100 ;
let data = {
score : 52.7 ,
gradingData : [
{
title : "Unsustainable" ,
color : "#ee1f25" ,
lowScore : -100 ,
highScore : -20
},
{
title : "Volatile" ,
color : "#f04922" ,
lowScore : -20 ,
highScore : 0
},
{
title : "Foundational" ,
color : "#fdae19" ,
lowScore : 0 ,
highScore : 20
},
{
title : "Developing" ,
color : "#f3eb0c" ,
lowScore : 20 ,
highScore : 40
},
{
title : "Maturing" ,
color : "#b0d136" ,
lowScore : 40 ,
highScore : 60
},
{
title : "Sustainable" ,
color : "#54b947" ,
lowScore : 60 ,
highScore : 80
},
{
title : "High Performing" ,
color : "#0f9747" ,
lowScore : 80 ,
highScore : 100
}
]
};
function lookUpGrade (lookupScore, grades ) {
for (var i = 0 ; i < grades.length ; i++) {
if (
grades[i].lowScore < lookupScore &&
grades[i].highScore >= lookupScore
) {
return grades[i];
}
}
return null ;
}
let chart = am4core.create ("chartdiv" , am4charts.GaugeChart );
chart.hiddenState .properties .opacity = 0 ;
chart.fontSize = 11 ;
chart.innerRadius = am4core.percent (80 );
chart.resizable = true ;
let axis = chart.xAxes .push (new am4charts.ValueAxis ());
axis.min = chartMin;
axis.max = chartMax;
axis.strictMinMax = true ;
axis.renderer .radius = am4core.percent (80 );
axis.renderer .inside = true ;
axis.renderer .line .strokeOpacity = 0.1 ;
axis.renderer .ticks .template .disabled = false ;
axis.renderer .ticks .template .strokeOpacity = 1 ;
axis.renderer .ticks .template .strokeWidth = 0.5 ;
axis.renderer .ticks .template .length = 5 ;
axis.renderer .grid .template .disabled = true ;
axis.renderer .labels .template .radius = am4core.percent (15 );
axis.renderer .labels .template .fontSize = "0.9em" ;
let axis2 = chart.xAxes .push (new am4charts.ValueAxis ());
axis2.min = chartMin;
axis2.max = chartMax;
axis2.strictMinMax = true ;
axis2.renderer .labels .template .disabled = true ;
axis2.renderer .ticks .template .disabled = true ;
axis2.renderer .grid .template .disabled = false ;
axis2.renderer .grid .template .opacity = 0.5 ;
axis2.renderer .labels .template .bent = true ;
axis2.renderer .labels .template .fill = am4core.color ("#000" );
axis2.renderer .labels .template .fontWeight = "bold" ;
axis2.renderer .labels .template .fillOpacity = 0.3 ;
for (let grading of data.gradingData ) {
let range = axis2.axisRanges .create ();
range.axisFill .fill = am4core.color (grading.color );
range.axisFill .fillOpacity = 0.8 ;
range.axisFill .zIndex = -1 ;
range.value = grading.lowScore > chartMin ? grading.lowScore : chartMin;
range.endValue = grading.highScore < chartMax ? grading.highScore : chartMax;
range.grid .strokeOpacity = 0 ;
range.stroke = am4core.color (grading.color ).lighten (-0.1 );
range.label .inside = true ;
range.label .text = grading.title .toUpperCase ();
range.label .inside = true ;
range.label .location = 0.5 ;
range.label .inside = true ;
range.label .radius = am4core.percent (10 );
range.label .paddingBottom = -5 ;
range.label .fontSize = "0.9em" ;
}
let matchingGrade = lookUpGrade (data.score , data.gradingData );
let label = chart.radarContainer .createChild (am4core.Label );
label.isMeasured = false ;
label.fontSize = "6em" ;
label.x = am4core.percent (50 );
label.paddingBottom = 15 ;
label.horizontalCenter = "middle" ;
label.verticalCenter = "bottom" ;
label.text = data.score .toFixed (1 );
label.fill = am4core.color (matchingGrade.color );
let label2 = chart.radarContainer .createChild (am4core.Label );
label2.isMeasured = false ;
label2.fontSize = "2em" ;
label2.horizontalCenter = "middle" ;
label2.verticalCenter = "bottom" ;
label2.text = matchingGrade.title .toUpperCase ();
label2.fill = am4core.color (matchingGrade.color );
let hand = chart.hands .push (new am4charts.ClockHand ());
hand.axis = axis2;
hand.innerRadius = am4core.percent (55 );
hand.startWidth = 8 ;
hand.pin .disabled = true ;
hand.value = data.score ;
hand.fill = am4core.color ("#444" );
hand.stroke = am4core.color ("#000" );
hand.events .on ("positionchanged" , function (text = axis2.positionToValue (hand.currentPosition ).toFixed (1 );
let value2 = axis.positionToValue (hand.currentPosition );
let matchingGrade = lookUpGrade (axis.positionToValue (hand.currentPosition ), data.gradingData );
label2.text = matchingGrade.title .toUpperCase ();
label2.fill = am4core.color (matchingGrade.color );
label2.stroke = am4core.color (matchingGrade.color );
label.fill = am4core.color (matchingGrade.color );
})
setInterval (function (let value = chartMin + Math .random () * (chartMax - chartMin);
hand.showValue (value, 1000 , am4core.ease .cubicOut );
}, 2000 );