<!-- Styles --><style>#chartdiv {
width: 100%;
height: 500px;
}
</style><!-- Resources --><scriptsrc="https://cdn.amcharts.com/lib/4/core.js"></script><scriptsrc="https://cdn.amcharts.com/lib/4/charts.js"></script><scriptsrc="https://cdn.amcharts.com/lib/4/themes/animated.js"></script><!-- Chart code --><script>
am4core.ready(function() {
// Themes begin
am4core.useTheme(am4themes_animated);
// Themes endvar chart = am4core.create("chartdiv", am4charts.XYChart);
// some extra padding for range labels
chart.paddingBottom = 50;
chart.cursor = new am4charts.XYCursor();
chart.scrollbarX = new am4core.Scrollbar();
// will use this to store colors of the same itemsvar colors = {};
var categoryAxis = chart.xAxes.push(new am4charts.CategoryAxis());
categoryAxis.dataFields.category = "category";
categoryAxis.renderer.minGridDistance = 60;
categoryAxis.renderer.grid.template.location = 0;
categoryAxis.dataItems.template.text = "{realName}";
categoryAxis.adapter.add("tooltipText", function(tooltipText, target){
return categoryAxis.tooltipDataItem.dataContext.realName;
})
var valueAxis = chart.yAxes.push(new am4charts.ValueAxis());
valueAxis.tooltip.disabled = true;
valueAxis.min = 0;
// single column series for all datavar columnSeries = chart.series.push(new am4charts.ColumnSeries());
columnSeries.columns.template.width = am4core.percent(80);
columnSeries.tooltipText = "{provider}: {realName}, {valueY}";
columnSeries.dataFields.categoryX = "category";
columnSeries.dataFields.valueY = "value";
// second value axis for quantityvar valueAxis2 = chart.yAxes.push(new am4charts.ValueAxis());
valueAxis2.renderer.opposite = true;
valueAxis2.syncWithAxis = valueAxis;
valueAxis2.tooltip.disabled = true;
// quantity line seriesvar lineSeries = chart.series.push(new am4charts.LineSeries());
lineSeries.tooltipText = "{valueY}";
lineSeries.dataFields.categoryX = "category";
lineSeries.dataFields.valueY = "quantity";
lineSeries.yAxis = valueAxis2;
lineSeries.bullets.push(new am4charts.CircleBullet());
lineSeries.stroke = chart.colors.getIndex(13);
lineSeries.fill = lineSeries.stroke;
lineSeries.strokeWidth = 2;
lineSeries.snapTooltip = true;
// when data validated, adjust location of data item based on count
lineSeries.events.on("datavalidated", function(){
lineSeries.dataItems.each(function(dataItem){
// if count divides by two, location is 0 (on the grid)if(dataItem.dataContext.count / 2 == Math.round(dataItem.dataContext.count / 2)){
dataItem.setLocation("categoryX", 0);
}
// otherwise location is 0.5 (middle)else{
dataItem.setLocation("categoryX", 0.5);
}
})
})
// fill adapter, here we save color value to colors object so that each time the item has the same name, the same color is used
columnSeries.columns.template.adapter.add("fill", function(fill, target) {
var name = target.dataItem.dataContext.realName;
if (!colors[name]) {
colors[name] = chart.colors.next();
}
target.stroke = colors[name];
return colors[name];
})
var rangeTemplate = categoryAxis.axisRanges.template;
rangeTemplate.tick.disabled = false;
rangeTemplate.tick.location = 0;
rangeTemplate.tick.strokeOpacity = 0.6;
rangeTemplate.tick.length = 60;
rangeTemplate.grid.strokeOpacity = 0.5;
rangeTemplate.label.tooltip = new am4core.Tooltip();
rangeTemplate.label.tooltip.dy = -10;
rangeTemplate.label.cloneTooltip = false;
///// DATAvar chartData = [];
var lineSeriesData = [];
var data =
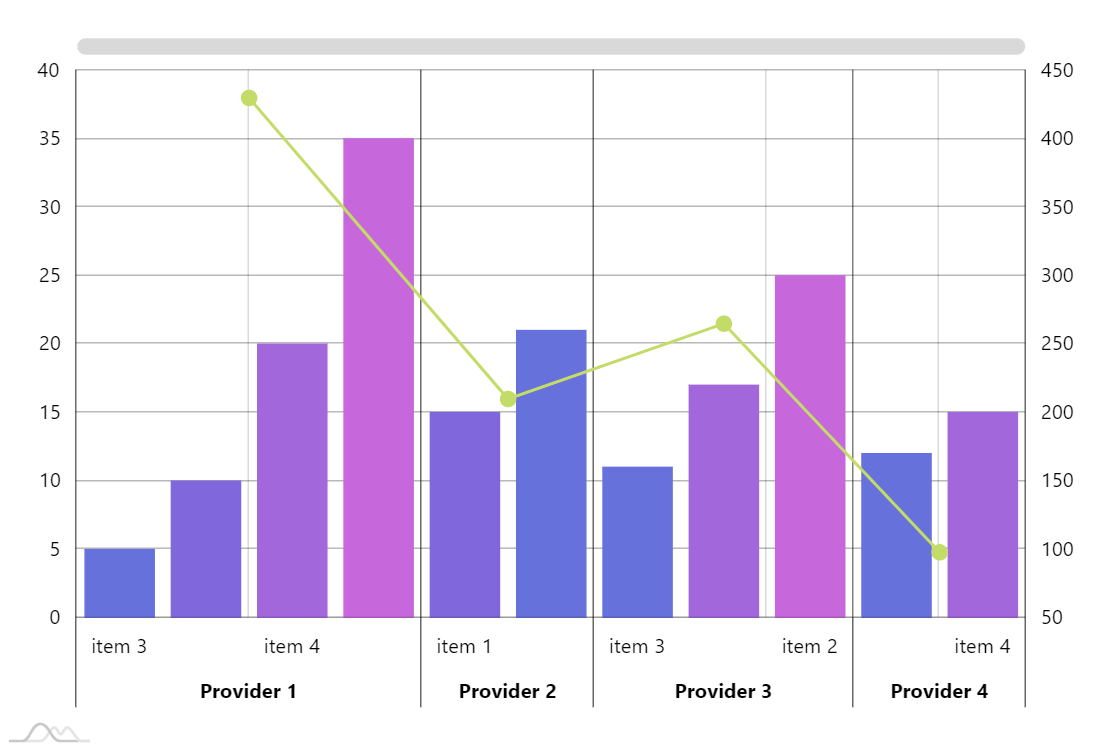
{
"Provider 1": {
"item 1": 10,
"item 2": 35,
"item 3": 5,
"item 4": 20,
"quantity":430
},
"Provider 2": {
"item 1": 15,
"item 3": 21,
"quantity":210
},
"Provider 3": {
"item 2": 25,
"item 3": 11,
"item 4": 17,
"quantity":265
},
"Provider 4": {
"item 3": 12,
"item 4": 15,
"quantity":98
}
}
// process data ant prepare it for the chartfor (var providerName in data) {
var providerData = data[providerName];
// add data of one provider to temp arrayvar tempArray = [];
var count = 0;
// add itemsfor (var itemName in providerData) {
if(itemName != "quantity"){
count++;
// we generate unique category for each column (providerName + "_" + itemName) and store realName
tempArray.push({ category: providerName + "_" + itemName, realName: itemName, value: providerData[itemName], provider: providerName})
}
}
// sort temp array
tempArray.sort(function(a, b) {
if (a.value > b.value) {
return1;
}
elseif (a.value < b.value) {
return -1
}
else {
return0;
}
})
// add quantity and count to middle data item (line series uses it)var lineSeriesDataIndex = Math.floor(count / 2);
tempArray[lineSeriesDataIndex].quantity = providerData.quantity;
tempArray[lineSeriesDataIndex].count = count;
// push to the final data
am4core.array.each(tempArray, function(item) {
chartData.push(item);
})
// create range (the additional label at the bottom)var range = categoryAxis.axisRanges.create();
range.category = tempArray[0].category;
range.endCategory = tempArray[tempArray.length - 1].category;
range.label.text = tempArray[0].provider;
range.label.dy = 30;
range.label.truncate = true;
range.label.fontWeight = "bold";
range.label.tooltipText = tempArray[0].provider;
range.label.adapter.add("maxWidth", function(maxWidth, target){
var range = target.dataItem;
var startPosition = categoryAxis.categoryToPosition(range.category, 0);
var endPosition = categoryAxis.categoryToPosition(range.endCategory, 1);
var startX = categoryAxis.positionToCoordinate(startPosition);
var endX = categoryAxis.positionToCoordinate(endPosition);
return endX - startX;
})
}
chart.data = chartData;
// last tickvar range = categoryAxis.axisRanges.create();
range.category = chart.data[chart.data.length - 1].category;
range.label.disabled = true;
range.tick.location = 1;
range.grid.location = 1;
}); // end am4core.ready()</script><!-- HTML --><divid="chartdiv"></div>
/* Imports */import * as am4core from"@amcharts/amcharts4/core";
import * as am4charts from"@amcharts/amcharts4/charts";
import am4themes_animated from"@amcharts/amcharts4/themes/animated";
/* Chart code */// Themes begin
am4core.useTheme(am4themes_animated);
// Themes endlet chart = am4core.create("chartdiv", am4charts.XYChart);
// some extra padding for range labels
chart.paddingBottom = 50;
chart.cursor = new am4charts.XYCursor();
chart.scrollbarX = new am4core.Scrollbar();
// will use this to store colors of the same itemslet colors = {};
let categoryAxis = chart.xAxes.push(new am4charts.CategoryAxis());
categoryAxis.dataFields.category = "category";
categoryAxis.renderer.minGridDistance = 60;
categoryAxis.renderer.grid.template.location = 0;
categoryAxis.dataItems.template.text = "{realName}";
categoryAxis.adapter.add("tooltipText", function(tooltipText, target){
return categoryAxis.tooltipDataItem.dataContext.realName;
})
let valueAxis = chart.yAxes.push(new am4charts.ValueAxis());
valueAxis.tooltip.disabled = true;
valueAxis.min = 0;
// single column series for all datalet columnSeries = chart.series.push(new am4charts.ColumnSeries());
columnSeries.columns.template.width = am4core.percent(80);
columnSeries.tooltipText = "{provider}: {realName}, {valueY}";
columnSeries.dataFields.categoryX = "category";
columnSeries.dataFields.valueY = "value";
// second value axis for quantitylet valueAxis2 = chart.yAxes.push(new am4charts.ValueAxis());
valueAxis2.renderer.opposite = true;
valueAxis2.syncWithAxis = valueAxis;
valueAxis2.tooltip.disabled = true;
// quantity line serieslet lineSeries = chart.series.push(new am4charts.LineSeries());
lineSeries.tooltipText = "{valueY}";
lineSeries.dataFields.categoryX = "category";
lineSeries.dataFields.valueY = "quantity";
lineSeries.yAxis = valueAxis2;
lineSeries.bullets.push(new am4charts.CircleBullet());
lineSeries.stroke = chart.colors.getIndex(13);
lineSeries.fill = lineSeries.stroke;
lineSeries.strokeWidth = 2;
lineSeries.snapTooltip = true;
// when data validated, adjust location of data item based on count
lineSeries.events.on("datavalidated", function(){
lineSeries.dataItems.each(function(dataItem){
// if count divides by two, location is 0 (on the grid)if(dataItem.dataContext.count / 2 == Math.round(dataItem.dataContext.count / 2)){
dataItem.setLocation("categoryX", 0);
}
// otherwise location is 0.5 (middle)else{
dataItem.setLocation("categoryX", 0.5);
}
})
})
// fill adapter, here we save color value to colors object so that each time the item has the same name, the same color is used
columnSeries.columns.template.adapter.add("fill", function(fill, target) {
let name = target.dataItem.dataContext.realName;
if (!colors[name]) {
colors[name] = chart.colors.next();
}
target.stroke = colors[name];
return colors[name];
})
let rangeTemplate = categoryAxis.axisRanges.template;
rangeTemplate.tick.disabled = false;
rangeTemplate.tick.location = 0;
rangeTemplate.tick.strokeOpacity = 0.6;
rangeTemplate.tick.length = 60;
rangeTemplate.grid.strokeOpacity = 0.5;
rangeTemplate.label.tooltip = new am4core.Tooltip();
rangeTemplate.label.tooltip.dy = -10;
rangeTemplate.label.cloneTooltip = false;
///// DATAlet chartData = [];
let lineSeriesData = [];
let data =
{
"Provider 1": {
"item 1": 10,
"item 2": 35,
"item 3": 5,
"item 4": 20,
"quantity":430
},
"Provider 2": {
"item 1": 15,
"item 3": 21,
"quantity":210
},
"Provider 3": {
"item 2": 25,
"item 3": 11,
"item 4": 17,
"quantity":265
},
"Provider 4": {
"item 3": 12,
"item 4": 15,
"quantity":98
}
}
// process data ant prepare it for the chartfor (var providerName in data) {
let providerData = data[providerName];
// add data of one provider to temp arraylet tempArray = [];
let count = 0;
// add itemsfor (var itemName in providerData) {
if(itemName != "quantity"){
count++;
// we generate unique category for each column (providerName + "_" + itemName) and store realName
tempArray.push({ category: providerName + "_" + itemName, realName: itemName, value: providerData[itemName], provider: providerName})
}
}
// sort temp array
tempArray.sort(function(a, b) {
if (a.value > b.value) {
return1;
}
elseif (a.value < b.value) {
return -1
}
else {
return0;
}
})
// add quantity and count to middle data item (line series uses it)let lineSeriesDataIndex = Math.floor(count / 2);
tempArray[lineSeriesDataIndex].quantity = providerData.quantity;
tempArray[lineSeriesDataIndex].count = count;
// push to the final data
am4core.array.each(tempArray, function(item) {
chartData.push(item);
})
// create range (the additional label at the bottom)let range = categoryAxis.axisRanges.create();
range.category = tempArray[0].category;
range.endCategory = tempArray[tempArray.length - 1].category;
range.label.text = tempArray[0].provider;
range.label.dy = 30;
range.label.truncate = true;
range.label.fontWeight = "bold";
range.label.tooltipText = tempArray[0].provider;
range.label.adapter.add("maxWidth", function(maxWidth, target){
let range = target.dataItem;
let startPosition = categoryAxis.categoryToPosition(range.category, 0);
let endPosition = categoryAxis.categoryToPosition(range.endCategory, 1);
let startX = categoryAxis.positionToCoordinate(startPosition);
let endX = categoryAxis.positionToCoordinate(endPosition);
return endX - startX;
})
}
chart.data = chartData;
// last ticklet range = categoryAxis.axisRanges.create();
range.category = chart.data[chart.data.length - 1].category;
range.label.disabled = true;
range.tick.location = 1;
range.grid.location = 1;
We use cookies on our website to support technical features that enhance your user experience. We also collect anonymous analytical data, as described in our Privacy policy.
Attention, please!
We use cookies for essential website functionality, analytics, and ad performance measurement as per our Privacy Policy.