<!-- Styles --><style>#chartdiv {
width: 100%;
height: 500px;
}
</style><!-- Resources --><scriptsrc="https://cdn.amcharts.com/lib/4/core.js"></script><scriptsrc="https://cdn.amcharts.com/lib/4/maps.js"></script><scriptsrc="https://cdn.amcharts.com/lib/4/geodata/worldHigh.js"></script><scriptsrc="https://cdn.amcharts.com/lib/4/themes/animated.js"></script><!-- Chart code --><script>
am4core.ready(function() {
// Themes begin
am4core.useTheme(am4themes_animated);
// Themes end// Create map instancevar chart = am4core.create("chartdiv", am4maps.MapChart);
// Set map definition
chart.geodata = am4geodata_worldHigh;
// Set projection
chart.projection = new am4maps.projections.Mercator();
// Export
chart.exporting.menu = new am4core.ExportMenu();
// Zoom control
chart.zoomControl = new am4maps.ZoomControl();
var homeButton = new am4core.Button();
homeButton.events.on("hit", function() {
chart.goHome();
});
homeButton.icon = new am4core.Sprite();
homeButton.padding(7, 5, 7, 5);
homeButton.width = 30;
homeButton.icon.path = "M16,8 L14,8 L14,16 L10,16 L10,10 L6,10 L6,16 L2,16 L2,8 L0,8 L8,0 L16,8 Z M16,8";
homeButton.marginBottom = 10;
homeButton.parent = chart.zoomControl;
homeButton.insertBefore(chart.zoomControl.plusButton);
// Center on the groups by default
chart.homeZoomLevel = 3.5;
chart.homeGeoPoint = { longitude: 10, latitude: 52 };
var groupData = [
{
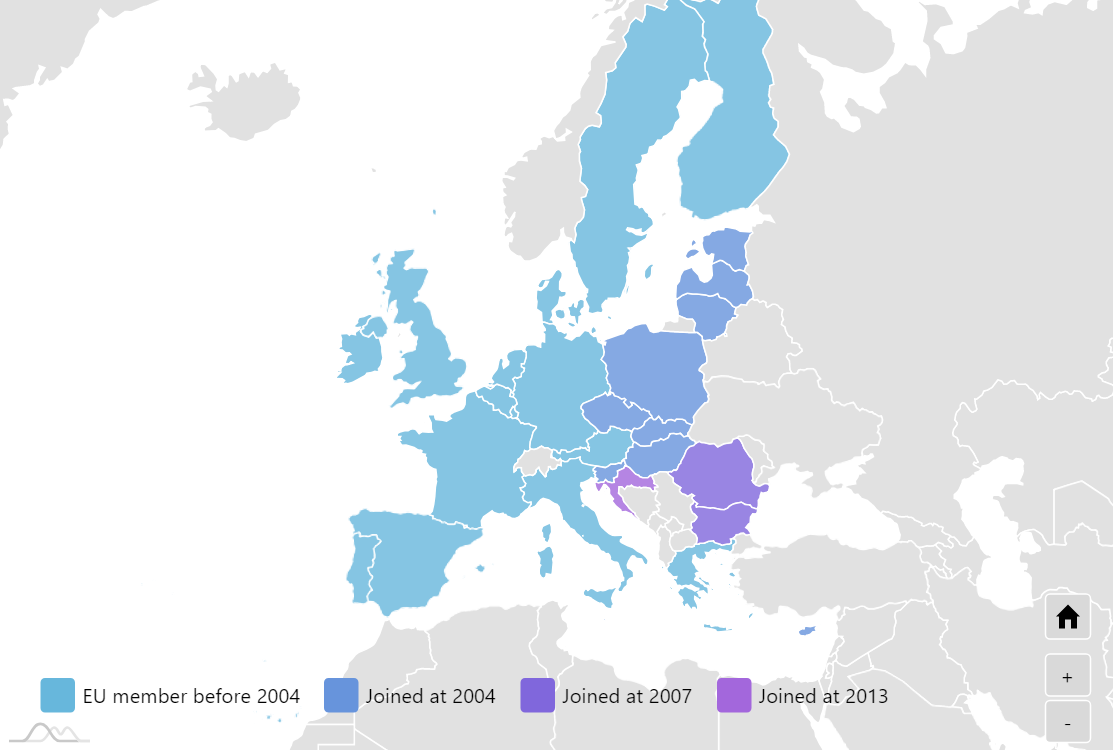
"name": "EU member before 2004",
"color": chart.colors.getIndex(0),
"data": [
{
"title": "Austria",
"id": "AT", // With MapPolygonSeries.useGeodata = true, it will try and match this id, then apply the other properties as custom data"customData": "1995"
}, {
"title": "Ireland",
"id": "IE",
"customData": "1973"
}, {
"title": "Denmark",
"id": "DK",
"customData": "1973"
}, {
"title": "Finland",
"id": "FI",
"customData": "1995"
}, {
"title": "Sweden",
"id": "SE",
"customData": "1995"
}, {
"title": "Great Britain",
"id": "GB",
"customData": "1973"
}, {
"title": "Italy",
"id": "IT",
"customData": "1957"
}, {
"title": "France",
"id": "FR",
"customData": "1957"
}, {
"title": "Spain",
"id": "ES",
"customData": "1986"
}, {
"title": "Greece",
"id": "GR",
"customData": "1981"
}, {
"title": "Germany",
"id": "DE",
"customData": "1957"
}, {
"title": "Belgium",
"id": "BE",
"customData": "1957"
}, {
"title": "Luxembourg",
"id": "LU",
"customData": "1957"
}, {
"title": "Netherlands",
"id": "NL",
"customData": "1957"
}, {
"title": "Portugal",
"id": "PT",
"customData": "1986"
}
]
},
{
"name": "Joined at 2004",
"color": chart.colors.getIndex(1),
"data": [
{
"title": "Lithuania",
"id": "LT",
"color": chart.colors.getIndex(1),
"customData": "2004",
"groupId": "2004"
}, {
"title": "Latvia",
"id": "LV",
"color": chart.colors.getIndex(1),
"customData": "2004",
"groupId": "2004"
}, {
"title": "Czech Republic ",
"id": "CZ",
"color": chart.colors.getIndex(1),
"customData": "2004",
"groupId": "2004"
}, {
"title": "Slovakia",
"id": "SK",
"color": chart.colors.getIndex(1),
"customData": "2004",
"groupId": "2004"
}, {
"title": "Slovenia",
"id": "SI",
"color": chart.colors.getIndex(1),
"customData": "2004",
"groupId": "2004"
}, {
"title": "Estonia",
"id": "EE",
"color": chart.colors.getIndex(1),
"customData": "2004",
"groupId": "2004"
}, {
"title": "Hungary",
"id": "HU",
"color": chart.colors.getIndex(1),
"customData": "2004",
"groupId": "2004"
}, {
"title": "Cyprus",
"id": "CY",
"color": chart.colors.getIndex(1),
"customData": "2004",
"groupId": "2004"
}, {
"title": "Malta",
"id": "MT",
"color": chart.colors.getIndex(1),
"customData": "2004",
"groupId": "2004"
}, {
"title": "Poland",
"id": "PL",
"color": chart.colors.getIndex(1),
"customData": "2004",
"groupId": "2004"
}
]
},
{
"name": "Joined at 2007",
"color": chart.colors.getIndex(3),
"data": [
{
"title": "Romania",
"id": "RO",
"customData": "2007"
}, {
"title": "Bulgaria",
"id": "BG",
"customData": "2007"
}
]
},
{
"name": "Joined at 2013",
"color": chart.colors.getIndex(4),
"data": [
{
"title": "Croatia",
"id": "HR",
"customData": "2013"
}
]
}
];
// This array will be populated with country IDs to exclude from the world seriesvar excludedCountries = ["AQ"];
// Create a series for each group, and populate the above array
groupData.forEach(function(group) {
var series = chart.series.push(new am4maps.MapPolygonSeries());
series.name = group.name;
series.useGeodata = true;
var includedCountries = [];
group.data.forEach(function(country) {
includedCountries.push(country.id);
excludedCountries.push(country.id);
});
series.include = includedCountries;
series.fill = am4core.color(group.color);
// By creating a hover state and setting setStateOnChildren to true, when we// hover over the series itself, it will trigger the hover SpriteState of all// its countries (provided those countries have a hover SpriteState, too!).
series.setStateOnChildren = true;
series.calculateVisualCenter = true;
// Country shape properties & behaviorsvar mapPolygonTemplate = series.mapPolygons.template;
// Instead of our custom title, we could also use {name} which comes from geodata
mapPolygonTemplate.fill = am4core.color(group.color);
mapPolygonTemplate.fillOpacity = 0.8;
mapPolygonTemplate.nonScalingStroke = true;
mapPolygonTemplate.tooltipPosition = "fixed"
mapPolygonTemplate.events.on("over", function(event) {
series.mapPolygons.each(function(mapPolygon) {
mapPolygon.isHover = true;
})
event.target.isHover = false;
event.target.isHover = true;
})
mapPolygonTemplate.events.on("out", function(event) {
series.mapPolygons.each(function(mapPolygon) {
mapPolygon.isHover = false;
})
})
// States var hoverState = mapPolygonTemplate.states.create("hover");
hoverState.properties.fill = am4core.color("#CC0000");
// Tooltip
mapPolygonTemplate.tooltipText = "{title} joined EU at {customData}"; // enables tooltip// series.tooltip.getFillFromObject = false; // prevents default colorization, which would make all tooltips red on hover// series.tooltip.background.fill = am4core.color(group.color);// MapPolygonSeries will mutate the data assigned to it, // we make and provide a copy of the original data array to leave it untouched.// (This method of copying works only for simple objects, e.g. it will not work// as predictably for deep copying custom Classes.)
series.data = JSON.parse(JSON.stringify(group.data));
});
// The rest of the world.var worldSeries = chart.series.push(new am4maps.MapPolygonSeries());
var worldSeriesName = "world";
worldSeries.name = worldSeriesName;
worldSeries.useGeodata = true;
worldSeries.exclude = excludedCountries;
worldSeries.fillOpacity = 0.8;
worldSeries.hiddenInLegend = true;
worldSeries.mapPolygons.template.nonScalingStroke = true;
// This auto-generates a legend according to each series' name and fill
chart.legend = new am4maps.Legend();
// Legend styles
chart.legend.paddingLeft = 27;
chart.legend.paddingRight = 27;
chart.legend.marginBottom = 15;
chart.legend.width = am4core.percent(90);
chart.legend.valign = "bottom";
chart.legend.contentAlign = "left";
// Legend items
chart.legend.itemContainers.template.interactionsEnabled = false;
}); // end am4core.ready()</script><!-- HTML --><divid="chartdiv"></div>
/* Imports */import * as am4core from"@amcharts/amcharts4/core";
import * as am4maps from"@amcharts/amcharts4/maps";
import am4geodata_worldHigh from"@amcharts/amcharts4-geodata/worldHigh";
import am4themes_animated from"@amcharts/amcharts4/themes/animated";
/* Chart code */// Themes begin
am4core.useTheme(am4themes_animated);
// Themes end// Create map instancelet chart = am4core.create("chartdiv", am4maps.MapChart);
// Set map definition
chart.geodata = am4geodata_worldHigh;
// Set projection
chart.projection = new am4maps.projections.Mercator();
// Export
chart.exporting.menu = new am4core.ExportMenu();
// Zoom control
chart.zoomControl = new am4maps.ZoomControl();
let homeButton = new am4core.Button();
homeButton.events.on("hit", function() {
chart.goHome();
});
homeButton.icon = new am4core.Sprite();
homeButton.padding(7, 5, 7, 5);
homeButton.width = 30;
homeButton.icon.path = "M16,8 L14,8 L14,16 L10,16 L10,10 L6,10 L6,16 L2,16 L2,8 L0,8 L8,0 L16,8 Z M16,8";
homeButton.marginBottom = 10;
homeButton.parent = chart.zoomControl;
homeButton.insertBefore(chart.zoomControl.plusButton);
// Center on the groups by default
chart.homeZoomLevel = 3.5;
chart.homeGeoPoint = { longitude: 10, latitude: 52 };
let groupData = [
{
"name": "EU member before 2004",
"color": chart.colors.getIndex(0),
"data": [
{
"title": "Austria",
"id": "AT", // With MapPolygonSeries.useGeodata = true, it will try and match this id, then apply the other properties as custom data"customData": "1995"
}, {
"title": "Ireland",
"id": "IE",
"customData": "1973"
}, {
"title": "Denmark",
"id": "DK",
"customData": "1973"
}, {
"title": "Finland",
"id": "FI",
"customData": "1995"
}, {
"title": "Sweden",
"id": "SE",
"customData": "1995"
}, {
"title": "Great Britain",
"id": "GB",
"customData": "1973"
}, {
"title": "Italy",
"id": "IT",
"customData": "1957"
}, {
"title": "France",
"id": "FR",
"customData": "1957"
}, {
"title": "Spain",
"id": "ES",
"customData": "1986"
}, {
"title": "Greece",
"id": "GR",
"customData": "1981"
}, {
"title": "Germany",
"id": "DE",
"customData": "1957"
}, {
"title": "Belgium",
"id": "BE",
"customData": "1957"
}, {
"title": "Luxembourg",
"id": "LU",
"customData": "1957"
}, {
"title": "Netherlands",
"id": "NL",
"customData": "1957"
}, {
"title": "Portugal",
"id": "PT",
"customData": "1986"
}
]
},
{
"name": "Joined at 2004",
"color": chart.colors.getIndex(1),
"data": [
{
"title": "Lithuania",
"id": "LT",
"color": chart.colors.getIndex(1),
"customData": "2004",
"groupId": "2004"
}, {
"title": "Latvia",
"id": "LV",
"color": chart.colors.getIndex(1),
"customData": "2004",
"groupId": "2004"
}, {
"title": "Czech Republic ",
"id": "CZ",
"color": chart.colors.getIndex(1),
"customData": "2004",
"groupId": "2004"
}, {
"title": "Slovakia",
"id": "SK",
"color": chart.colors.getIndex(1),
"customData": "2004",
"groupId": "2004"
}, {
"title": "Slovenia",
"id": "SI",
"color": chart.colors.getIndex(1),
"customData": "2004",
"groupId": "2004"
}, {
"title": "Estonia",
"id": "EE",
"color": chart.colors.getIndex(1),
"customData": "2004",
"groupId": "2004"
}, {
"title": "Hungary",
"id": "HU",
"color": chart.colors.getIndex(1),
"customData": "2004",
"groupId": "2004"
}, {
"title": "Cyprus",
"id": "CY",
"color": chart.colors.getIndex(1),
"customData": "2004",
"groupId": "2004"
}, {
"title": "Malta",
"id": "MT",
"color": chart.colors.getIndex(1),
"customData": "2004",
"groupId": "2004"
}, {
"title": "Poland",
"id": "PL",
"color": chart.colors.getIndex(1),
"customData": "2004",
"groupId": "2004"
}
]
},
{
"name": "Joined at 2007",
"color": chart.colors.getIndex(3),
"data": [
{
"title": "Romania",
"id": "RO",
"customData": "2007"
}, {
"title": "Bulgaria",
"id": "BG",
"customData": "2007"
}
]
},
{
"name": "Joined at 2013",
"color": chart.colors.getIndex(4),
"data": [
{
"title": "Croatia",
"id": "HR",
"customData": "2013"
}
]
}
];
// This array will be populated with country IDs to exclude from the world serieslet excludedCountries = ["AQ"];
// Create a series for each group, and populate the above array
groupData.forEach(function(group) {
let series = chart.series.push(new am4maps.MapPolygonSeries());
series.name = group.name;
series.useGeodata = true;
let includedCountries = [];
group.data.forEach(function(country) {
includedCountries.push(country.id);
excludedCountries.push(country.id);
});
series.include = includedCountries;
series.fill = am4core.color(group.color);
// By creating a hover state and setting setStateOnChildren to true, when we// hover over the series itself, it will trigger the hover SpriteState of all// its countries (provided those countries have a hover SpriteState, too!).
series.setStateOnChildren = true;
series.calculateVisualCenter = true;
// Country shape properties & behaviorslet mapPolygonTemplate = series.mapPolygons.template;
// Instead of our custom title, we could also use {name} which comes from geodata
mapPolygonTemplate.fill = am4core.color(group.color);
mapPolygonTemplate.fillOpacity = 0.8;
mapPolygonTemplate.nonScalingStroke = true;
mapPolygonTemplate.tooltipPosition = "fixed"
mapPolygonTemplate.events.on("over", function(event) {
series.mapPolygons.each(function(mapPolygon) {
mapPolygon.isHover = true;
})
event.target.isHover = false;
event.target.isHover = true;
})
mapPolygonTemplate.events.on("out", function(event) {
series.mapPolygons.each(function(mapPolygon) {
mapPolygon.isHover = false;
})
})
// States let hoverState = mapPolygonTemplate.states.create("hover");
hoverState.properties.fill = am4core.color("#CC0000");
// Tooltip
mapPolygonTemplate.tooltipText = "{title} joined EU at {customData}"; // enables tooltip// series.tooltip.getFillFromObject = false; // prevents default colorization, which would make all tooltips red on hover// series.tooltip.background.fill = am4core.color(group.color);// MapPolygonSeries will mutate the data assigned to it, // we make and provide a copy of the original data array to leave it untouched.// (This method of copying works only for simple objects, e.g. it will not work// as predictably for deep copying custom Classes.)
series.data = JSON.parse(JSON.stringify(group.data));
});
// The rest of the world.let worldSeries = chart.series.push(new am4maps.MapPolygonSeries());
let worldSeriesName = "world";
worldSeries.name = worldSeriesName;
worldSeries.useGeodata = true;
worldSeries.exclude = excludedCountries;
worldSeries.fillOpacity = 0.8;
worldSeries.hiddenInLegend = true;
worldSeries.mapPolygons.template.nonScalingStroke = true;
// This auto-generates a legend according to each series' name and fill
chart.legend = new am4maps.Legend();
// Legend styles
chart.legend.paddingLeft = 27;
chart.legend.paddingRight = 27;
chart.legend.marginBottom = 15;
chart.legend.width = am4core.percent(90);
chart.legend.valign = "bottom";
chart.legend.contentAlign = "left";
// Legend items
chart.legend.itemContainers.template.interactionsEnabled = false;
We use cookies on our website to support technical features that enhance your user experience. We also collect anonymous analytical data, as described in our Privacy policy.