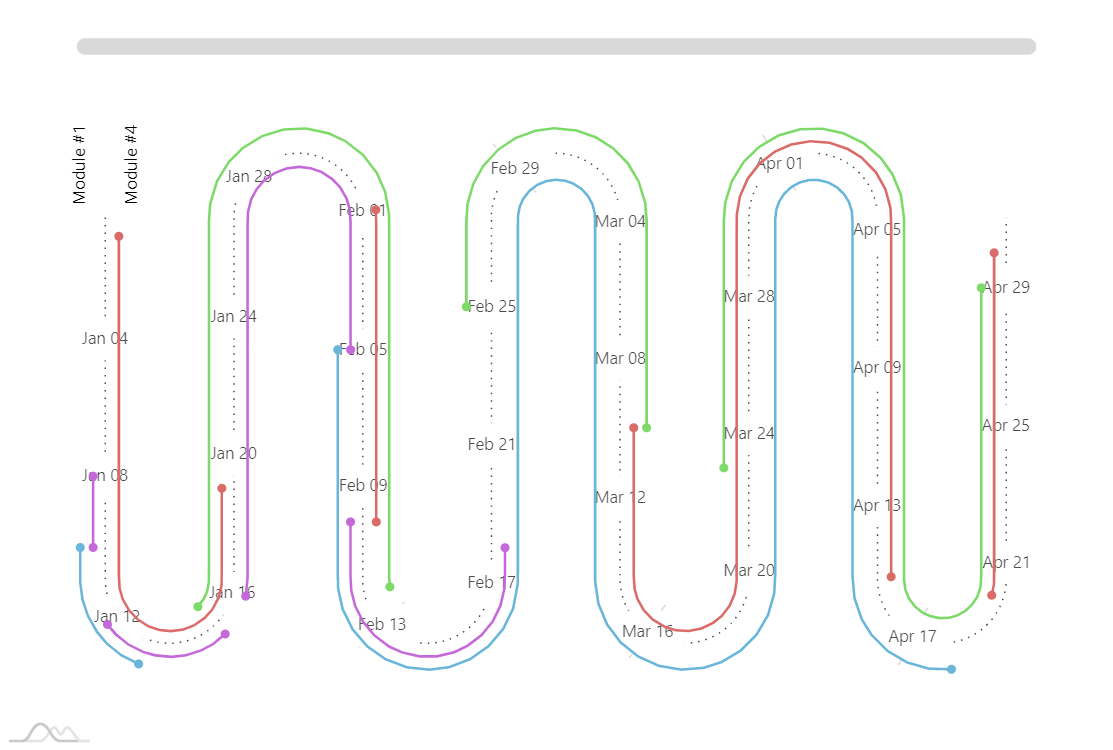
Horizontal Serpentine chart
This demo uses amCharts 4 TimeLine add-on.
Demo source
<!-- Styles -->
<style>
#chartdiv {
  width: 100%;
  height: 600px;
}

.demo-theme-dark .demo-background {
  background: #000;
}

</style>

<!-- Resources -->
<script src="https://cdn.amcharts.com/lib/4/core.js"></script>
<script src="https://cdn.amcharts.com/lib/4/charts.js"></script>
<script src="https://cdn.amcharts.com/lib/4/plugins/timeline.js"></script>
<script src="https://cdn.amcharts.com/lib/4/plugins/bullets.js"></script>
<script src="https://cdn.amcharts.com/lib/4/themes/animated.js"></script>

<!-- Chart code -->
<script>
am4core.ready(function() {

// Themes begin
am4core.useTheme(am4themes_animated);
// Themes end

var chart = am4core.create("chartdiv", am4plugins_timeline.SerpentineChart);
chart.curveContainer.padding(20,20,20,20);
chart.levelCount = 8;
chart.orientation = "horizontal";
chart.fontSize = 11;

var colorSet = new am4core.ColorSet();
colorSet.saturation = 0.6;

chart.data = [ {
  "category": "Module #1",
  "start": "2016-01-10",
  "end": "2016-01-13",
  "color": colorSet.getIndex(0),
  "task": "Gathering requirements"
}, {
  "category": "Module #1",
  "start": "2016-02-05",
  "end": "2016-04-18",
  "color": colorSet.getIndex(0),
  "task": "Development"
}, {
  "category": "Module #2",
  "start": "2016-01-08",
  "end": "2016-01-10",
  "color": colorSet.getIndex(5),
  "task": "Gathering requirements"
}, {
  "category": "Module #2",
  "start": "2016-01-12",
  "end": "2016-01-15",
  "color": colorSet.getIndex(5),
  "task": "Producing specifications"
}, {
  "category": "Module #2",
  "start": "2016-01-16",
  "end": "2016-02-05",
  "color": colorSet.getIndex(5),
  "task": "Development"
}, {
  "category": "Module #2",
  "start": "2016-02-10",
  "end": "2016-02-18",
  "color": colorSet.getIndex(5),
  "task": "Testing and QA"
}, {
  "category": "",
  "task": ""
},{
  "category": "Module #3",
  "start": "2016-01-01",
  "end": "2016-01-19",
  "color": colorSet.getIndex(9),
  "task": "Gathering requirements"
}, {
  "category": "Module #3",
  "start": "2016-02-01",
  "end": "2016-02-10",
  "color": colorSet.getIndex(9),
  "task": "Producing specifications"
}, {
  "category": "Module #3",
  "start": "2016-03-10",
  "end": "2016-04-15",
  "color": colorSet.getIndex(9),
  "task": "Development"
}, {
  "category": "Module #3",
  "start": "2016-04-20",
  "end": "2016-04-30",
  "color": colorSet.getIndex(9),
  "task": "Testing and QA"
}, {
  "category": "Module #4",
  "start": "2016-01-15",
  "end": "2016-02-12",
  "color": colorSet.getIndex(15),
  "task": "Gathering requirements"
},{
  "category": "Module #4",
  "start": "2016-02-25",
  "end": "2016-03-10",
  "color": colorSet.getIndex(15),
  "task": "Development"
}, {
  "category": "Module #4",
  "start": "2016-03-23",
  "end": "2016-04-29",
  "color": colorSet.getIndex(15),
  "task": "Testing and QA"
} ];

chart.dateFormatter.dateFormat = "yyyy-MM-dd";
chart.dateFormatter.inputDateFormat = "yyyy-MM-dd";

var categoryAxis = chart.yAxes.push(new am4charts.CategoryAxis());
categoryAxis.dataFields.category = "category";
categoryAxis.renderer.grid.template.disabled = true;
categoryAxis.renderer.labels.template.paddingRight = 25;
categoryAxis.renderer.minGridDistance = 10;
categoryAxis.renderer.innerRadius = -60;
categoryAxis.renderer.radius = 60;

var dateAxis = chart.xAxes.push(new am4charts.DateAxis());
dateAxis.renderer.minGridDistance = 70;
dateAxis.baseInterval = { count: 1, timeUnit: "day" };

dateAxis.renderer.tooltipLocation = 0;
dateAxis.startLocation = -0.5;
dateAxis.renderer.line.strokeDasharray = "1,4";
dateAxis.renderer.line.strokeOpacity = 0.7;
dateAxis.tooltip.background.fillOpacity = 0.2;
dateAxis.tooltip.background.cornerRadius = 5;
dateAxis.tooltip.label.fill = new am4core.InterfaceColorSet().getFor("alternativeBackground");
dateAxis.tooltip.label.paddingTop = 7;

var labelTemplate = dateAxis.renderer.labels.template;
labelTemplate.verticalCenter = "middle";
labelTemplate.fillOpacity = 0.7;
labelTemplate.background.fill =  new am4core.InterfaceColorSet().getFor("background");
labelTemplate.background.fillOpacity = 1;
labelTemplate.padding(7,7,7,7);

var categoryAxisLabelTemplate = categoryAxis.renderer.labels.template;
categoryAxisLabelTemplate.horizontalCenter = "left";
categoryAxisLabelTemplate.adapter.add("rotation", function (rotation, target) {
  var position = dateAxis.valueToPosition(dateAxis.min);
  return dateAxis.renderer.positionToAngle(position) + 90;
})

var series1 = chart.series.push(new am4plugins_timeline.CurveColumnSeries());
series1.columns.template.height = am4core.percent(20);
series1.columns.template.tooltipText = "{task}: [bold]{openDateX}[/] - [bold]{dateX}[/]";

series1.dataFields.openDateX = "start";
series1.dataFields.dateX = "end";
series1.dataFields.categoryY = "category";
series1.columns.template.propertyFields.fill = "color"; // get color from data
series1.columns.template.propertyFields.stroke = "color";
series1.columns.template.strokeOpacity = 0;

var bullet = new am4charts.CircleBullet();
series1.bullets.push(bullet);
bullet.circle.radius = 3;
bullet.circle.strokeOpacity = 0;
bullet.propertyFields.fill = "color";
bullet.locationX = 0;


var bullet2 = new am4charts.CircleBullet();
series1.bullets.push(bullet2);
bullet2.circle.radius = 3;
bullet2.circle.strokeOpacity = 0;
bullet2.propertyFields.fill = "color";
bullet2.locationX = 1;

chart.scrollbarX = new am4core.Scrollbar();
chart.scrollbarX.align = "center"
chart.scrollbarX.width = am4core.percent(90);

var cursor = new am4plugins_timeline.CurveCursor();
chart.cursor = cursor;
cursor.xAxis = dateAxis;
cursor.yAxis = categoryAxis;
cursor.lineY.disabled = true;
cursor.lineX.strokeDasharray = "1,4";
cursor.lineX.strokeOpacity = 1;

dateAxis.renderer.tooltipLocation2 = 0;
categoryAxis.cursorTooltipEnabled = false;

}); // end am4core.ready()
</script>

<!-- HTML -->
<div id="chartdiv"></div>