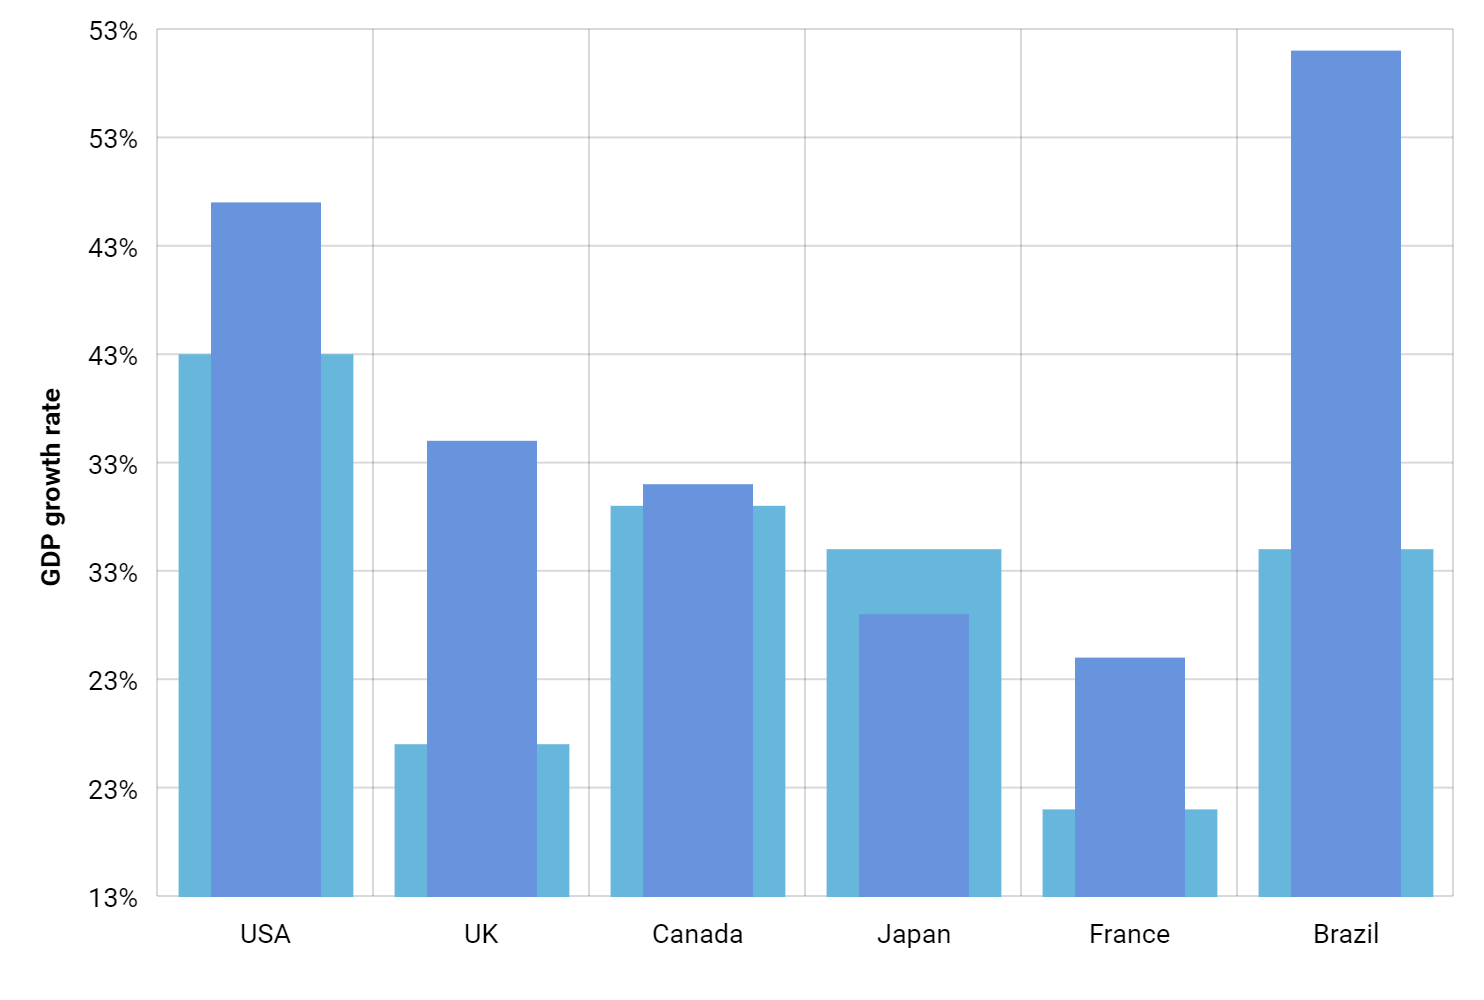
Layered Column Chart
In some scenarios, showing multiple column series side-by-side (clustered) is the best and most “standard” way to display multiple column series. However, when each series has equal and fairly limited number of items, layering series on top of each other presents a much more impactful visualization.
To achieve that with amCharts 4, you just disable clustering on each series (series.clustered = false) and then make columns in one of them wider (or narrower) than the other (series2.columns.template.width = am4core.percent(50)).
Demo source
<!-- Styles -->
<style>
#chartdiv {
  width: 100%;
  height: 500px;
}

</style>

<!-- Resources -->
<script src="https://cdn.amcharts.com/lib/4/core.js"></script>
<script src="https://cdn.amcharts.com/lib/4/charts.js"></script>
<script src="https://cdn.amcharts.com/lib/4/themes/animated.js"></script>

<!-- Chart code -->
<script>
am4core.ready(function() {

// Themes begin
am4core.useTheme(am4themes_animated);
// Themes end

// Create chart instance
var chart = am4core.create("chartdiv", am4charts.XYChart);

// Add percent sign to all numbers
chart.numberFormatter.numberFormat = "#.#'%'";

// Add data
chart.data = [{
    "country": "USA",
    "year2004": 3.5,
    "year2005": 4.2
}, {
    "country": "UK",
    "year2004": 1.7,
    "year2005": 3.1
}, {
    "country": "Canada",
    "year2004": 2.8,
    "year2005": 2.9
}, {
    "country": "Japan",
    "year2004": 2.6,
    "year2005": 2.3
}, {
    "country": "France",
    "year2004": 1.4,
    "year2005": 2.1
}, {
    "country": "Brazil",
    "year2004": 2.6,
    "year2005": 4.9
}];

// Create axes
var categoryAxis = chart.xAxes.push(new am4charts.CategoryAxis());
categoryAxis.dataFields.category = "country";
categoryAxis.renderer.grid.template.location = 0;
categoryAxis.renderer.minGridDistance = 30;

var valueAxis = chart.yAxes.push(new am4charts.ValueAxis());
valueAxis.title.text = "GDP growth rate";
valueAxis.title.fontWeight = 800;

// Create series
var series = chart.series.push(new am4charts.ColumnSeries());
series.dataFields.valueY = "year2004";
series.dataFields.categoryX = "country";
series.clustered = false;
series.tooltipText = "GDP grow in {categoryX} (2004): [bold]{valueY}[/]";

var series2 = chart.series.push(new am4charts.ColumnSeries());
series2.dataFields.valueY = "year2005";
series2.dataFields.categoryX = "country";
series2.clustered = false;
series2.columns.template.width = am4core.percent(50);
series2.tooltipText = "GDP grow in {categoryX} (2005): [bold]{valueY}[/]";

chart.cursor = new am4charts.XYCursor();
chart.cursor.lineX.disabled = true;
chart.cursor.lineY.disabled = true;

}); // end am4core.ready()
</script>

<!-- HTML -->
<div id="chartdiv"></div>