Line With Custom Bullets
Anything can be a bullet
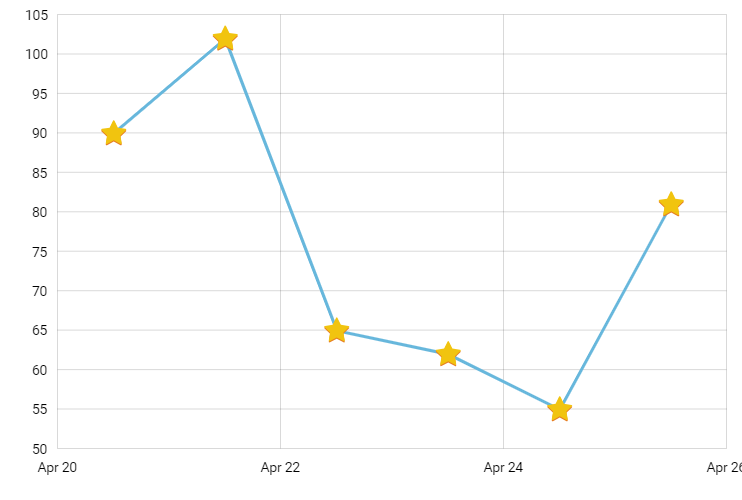
Besides pre-defined shapes, bullet can be anything in amCharts 4 – an SVG image or path, static image, another complex shape – even another chart.
More information about bullets
Demo source
<!-- Styles -->
<style>
#chartdiv {
  width: 100%;
  height: 500px;
}

</style>

<!-- Resources -->
<script src="https://cdn.amcharts.com/lib/4/core.js"></script>
<script src="https://cdn.amcharts.com/lib/4/charts.js"></script>
<script src="https://cdn.amcharts.com/lib/4/themes/animated.js"></script>

<!-- Chart code -->
<script>
am4core.ready(function() {

// Themes begin
am4core.useTheme(am4themes_animated);
// Themes end

// Create chart instance
var chart = am4core.create("chartdiv", am4charts.XYChart);

// Add data
chart.data = [{
  "date": new Date(2018, 3, 20),
  "value": 90
}, {
  "date": new Date(2018, 3, 21),
  "value": 102
}, {
  "date": new Date(2018, 3, 22),
  "value": 65
}, {
  "date": new Date(2018, 3, 23),
  "value": 62
}, {
  "date": new Date(2018, 3, 24),
  "value": 55
}, {
  "date": new Date(2018, 3, 25),
  "value": 81
}];

// Create axes
var dateAxis = chart.xAxes.push(new am4charts.DateAxis());

// Create value axis
var valueAxis = chart.yAxes.push(new am4charts.ValueAxis());

// Create series
var lineSeries = chart.series.push(new am4charts.LineSeries());
lineSeries.dataFields.valueY = "value";
lineSeries.dataFields.dateX = "date";
lineSeries.name = "Sales";
lineSeries.strokeWidth = 3;

// Add simple bullet
var bullet = lineSeries.bullets.push(new am4charts.Bullet());
var image = bullet.createChild(am4core.Image);
image.href = "https://www.amcharts.com/lib/images/star.svg";
image.width = 30;
image.height = 30;
image.horizontalCenter = "middle";
image.verticalCenter = "middle";

}); // end am4core.ready()
</script>

<!-- HTML -->
<div id="chartdiv"></div>