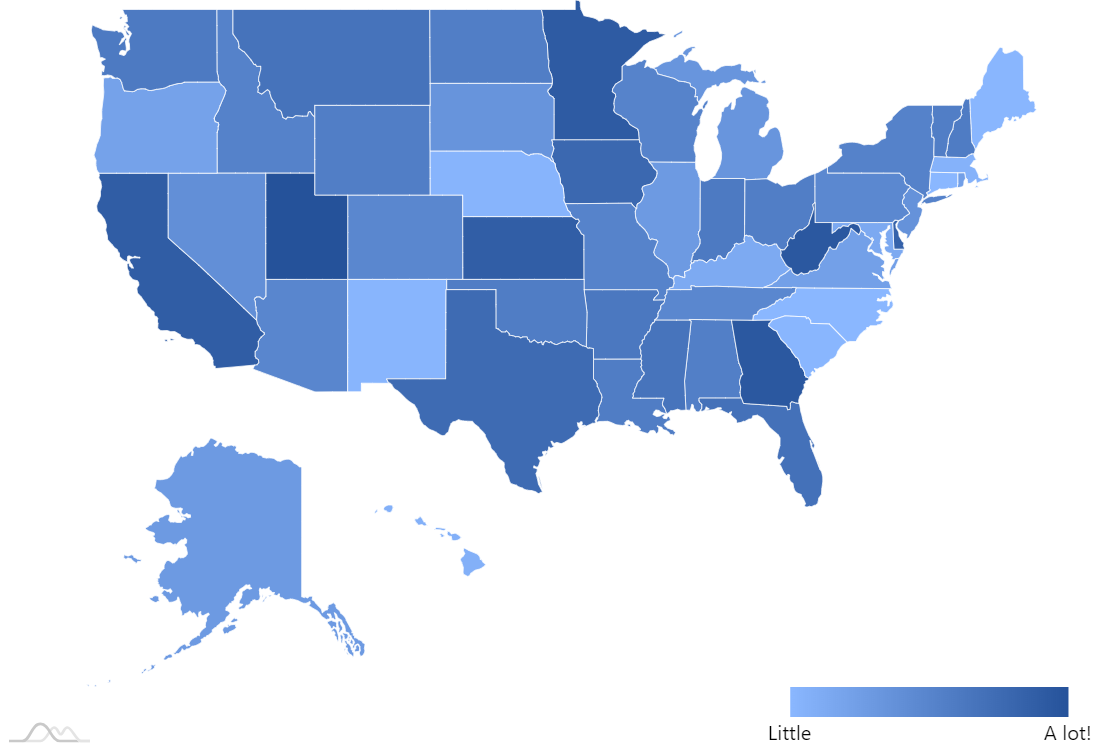
Location-sensitive map
This demo uses proprietary web service (based on MaxMind’s IP data base) to determine location of the visitor and serve appropriate heat map.
Dynamic map loading
The chart can load maps in GeoJSON format dynamically using built-in loader.
More about loading external maps
Demo source
<!-- Styles -->
<style>
#chartdiv {
  width: 100%;
  height: 500px
}

</style>

<!-- Resources -->
<script src="https://cdn.amcharts.com/lib/4/core.js"></script>
<script src="https://cdn.amcharts.com/lib/4/maps.js"></script>
<script src="https://cdn.amcharts.com/lib/4/geodata/data/countries2.js"></script>
<script src="https://cdn.amcharts.com/lib/4/themes/animated.js"></script>

<!-- Chart code -->
<script>
am4core.ready(function() {

// Themes begin
am4core.useTheme(am4themes_animated);
// Themes end

window.onload = function() {

/**
 * This demo uses our own method of determining user's location
 * It is not public web service that you can use
 * You'll need to find your own. We recommend http://www.maxmind.com
 */
jQuery.getJSON( "https://www.amcharts.com/tools/country/?v=xz6Z", function( geo ) {

  // Default map
  var defaultMap = "usaAlbersLow";

  // calculate which map to be used
  var currentMap = defaultMap;
  var title = "";
  if ( am4geodata_data_countries2[ geo.country_code ] !== undefined ) {
    currentMap = am4geodata_data_countries2[ geo.country_code ][ "maps" ][ 0 ];

    // add country title
    if ( am4geodata_data_countries2[ geo.country_code ][ "country" ] ) {
      title = am4geodata_data_countries2[ geo.country_code ][ "country" ];
    }

  }

  // Create map instance
  var chart = am4core.create("chartdiv", am4maps.MapChart);

  chart.titles.create().text = title;

  // Set map definition
  chart.geodataSource.url = "https://www.amcharts.com/lib/4/geodata/json/" + currentMap + ".json";
  chart.geodataSource.events.on("parseended", function(ev) {
    var data = [];
    for(var i = 0; i < ev.target.data.features.length; i++) {
      data.push({
        id: ev.target.data.features[i].id,
        value: Math.round( Math.random() * 10000 )
      })
    }
    polygonSeries.data = data;
  })

  // Set projection
  chart.projection = new am4maps.projections.Mercator();

  // Create map polygon series
  var polygonSeries = chart.series.push(new am4maps.MapPolygonSeries());

  //Set min/max fill color for each area
  polygonSeries.heatRules.push({
    property: "fill",
    target: polygonSeries.mapPolygons.template,
    min: chart.colors.getIndex(1).brighten(1),
    max: chart.colors.getIndex(1).brighten(-0.3)
  });

  // Make map load polygon data (state shapes and names) from GeoJSON
  polygonSeries.useGeodata = true;

  // Set up heat legend
  let heatLegend = chart.createChild(am4maps.HeatLegend);
  heatLegend.series = polygonSeries;
  heatLegend.align = "right";
  heatLegend.width = am4core.percent(25);
  heatLegend.marginRight = am4core.percent(4);
  heatLegend.minValue = 0;
  heatLegend.maxValue = 40000000;
  heatLegend.valign = "bottom";

  // Set up custom heat map legend labels using axis ranges
  var minRange = heatLegend.valueAxis.axisRanges.create();
  minRange.value = heatLegend.minValue;
  minRange.label.text = "Little";
  var maxRange = heatLegend.valueAxis.axisRanges.create();
  maxRange.value = heatLegend.maxValue;
  maxRange.label.text = "A lot!";

  // Blank out internal heat legend value axis labels
  heatLegend.valueAxis.renderer.labels.template.adapter.add("text", function(labelText) {
    return "";
  });

  // Configure series tooltip
  var polygonTemplate = polygonSeries.mapPolygons.template;
  polygonTemplate.tooltipText = "{name}: {value}";
  polygonTemplate.nonScalingStroke = true;
  polygonTemplate.strokeWidth = 0.5;

  // Create hover state and set alternative fill color
  var hs = polygonTemplate.states.create("hover");
  hs.properties.fill = chart.colors.getIndex(1).brighten(-0.5);

});

};

}); // end am4core.ready()
</script>

<!-- HTML -->
<div id="chartdiv"></div>