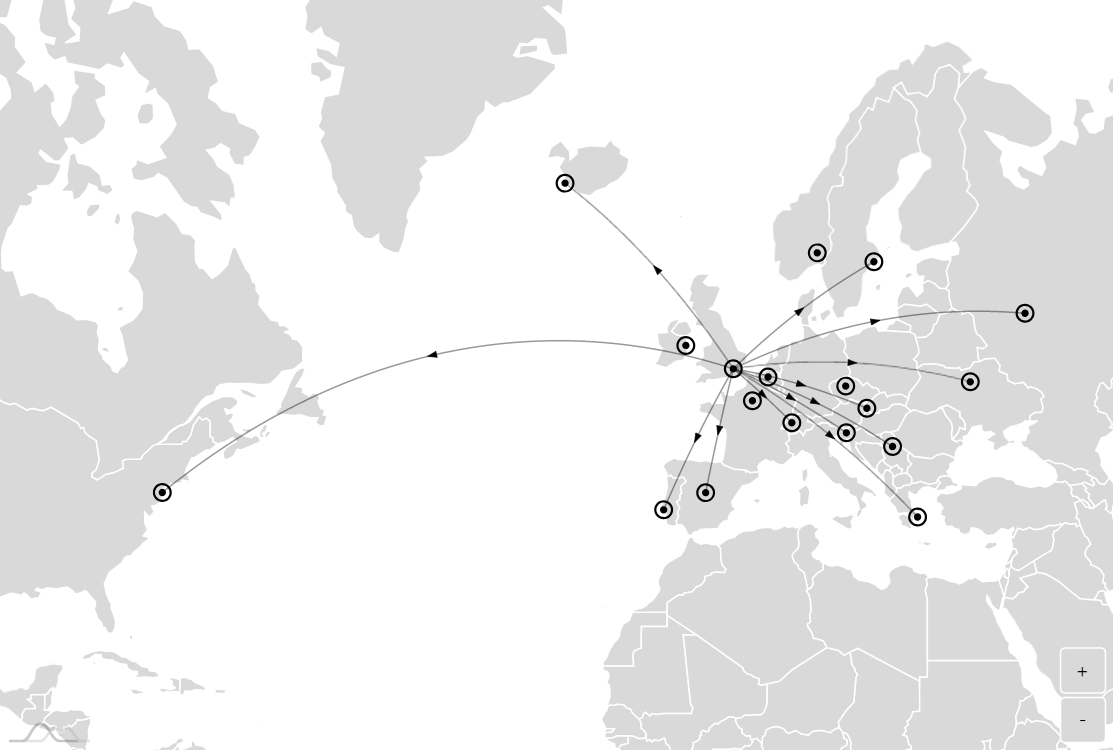
Map with curved lines
Maps with curved lines (also known as Connection map, Link map, Ray map) can be used to display connections and relationships geographically, visualize routes and more.
Line, arc, or spline
Map chart supports three distinctive types of lines.
Straight vs. curved
By default, the line shows the shortest distance, which means curved lines as it follows the curvature of the Earth surface.
Setting shortestDistance to false will make the lines perfectly straight.
More about shortest distance setting
Setting initial zoom
Any zoom level and position can be set using map’s homeZoomLevel and homeGeoPoint properties.
More about setting initial zoom
Demo source
<!-- Styles -->
<style>
#chartdiv {
  width: 100%;
  height: 500px;
}

</style>

<!-- Resources -->
<script src="https://cdn.amcharts.com/lib/4/core.js"></script>
<script src="https://cdn.amcharts.com/lib/4/maps.js"></script>
<script src="https://cdn.amcharts.com/lib/4/geodata/worldLow.js"></script>
<script src="https://cdn.amcharts.com/lib/4/themes/animated.js"></script>

<!-- Chart code -->
<script>
am4core.ready(function() {

// Themes begin
am4core.useTheme(am4themes_animated);
// Themes end

// Define marker path
var targetSVG = "M9,0C4.029,0,0,4.029,0,9s4.029,9,9,9s9-4.029,9-9S13.971,0,9,0z M9,15.93 c-3.83,0-6.93-3.1-6.93-6.93S5.17,2.07,9,2.07s6.93,3.1,6.93,6.93S12.83,15.93,9,15.93 M12.5,9c0,1.933-1.567,3.5-3.5,3.5S5.5,10.933,5.5,9S7.067,5.5,9,5.5 S12.5,7.067,12.5,9z";

// Create map instance
var chart = am4core.create("chartdiv", am4maps.MapChart);
var interfaceColors = new am4core.InterfaceColorSet();

// Set map definition
chart.geodata = am4geodata_worldLow;

// Set projection
chart.projection = new am4maps.projections.Mercator();

// Add zoom control
chart.zoomControl = new am4maps.ZoomControl();

// Set initial zoom
chart.homeZoomLevel = 2.5;
chart.homeGeoPoint = {
  latitude: 51,
  longitude: -23
};

// Create map polygon series
var polygonSeries = chart.series.push(new am4maps.MapPolygonSeries());
polygonSeries.exclude = ["AQ"];
polygonSeries.useGeodata = true;
polygonSeries.mapPolygons.template.nonScalingStroke = true;

// Add images
var imageSeries = chart.series.push(new am4maps.MapImageSeries());
var imageTemplate = imageSeries.mapImages.template;
imageTemplate.tooltipText = "{title}";
imageTemplate.nonScaling = true;

var marker = imageTemplate.createChild(am4core.Sprite);
marker.path = targetSVG;
marker.horizontalCenter = "middle";
marker.verticalCenter = "middle";
marker.scale = 0.7;
marker.fill = interfaceColors.getFor("alternativeBackground");

imageTemplate.propertyFields.latitude = "latitude";
imageTemplate.propertyFields.longitude = "longitude";
imageSeries.data = [ {
  "id": "london",
  "svgPath": targetSVG,
  "title": "London",
  "latitude": 51.5002,
  "longitude": -0.1262,
  "scale": 1
}, {
  "svgPath": targetSVG,
  "title": "Brussels",
  "latitude": 50.8371,
  "longitude": 4.3676,
  "scale": 0.5
}, {
  "svgPath": targetSVG,
  "title": "Prague",
  "latitude": 50.0878,
  "longitude": 14.4205,
  "scale": 0.5
}, {
  "svgPath": targetSVG,
  "title": "Athens",
  "latitude": 37.9792,
  "longitude": 23.7166,
  "scale": 0.5
}, {
  "svgPath": targetSVG,
  "title": "Reykjavik",
  "latitude": 64.1353,
  "longitude": -21.8952,
  "scale": 0.5
}, {
  "svgPath": targetSVG,
  "title": "Dublin",
  "latitude": 53.3441,
  "longitude": -6.2675,
  "scale": 0.5
}, {
  "svgPath": targetSVG,
  "title": "Oslo",
  "latitude": 59.9138,
  "longitude": 10.7387,
  "scale": 0.5
}, {
  "svgPath": targetSVG,
  "title": "Lisbon",
  "latitude": 38.7072,
  "longitude": -9.1355,
  "scale": 0.5
}, {
  "svgPath": targetSVG,
  "title": "Moscow",
  "latitude": 55.7558,
  "longitude": 37.6176,
  "scale": 0.5
}, {
  "svgPath": targetSVG,
  "title": "Belgrade",
  "latitude": 44.8048,
  "longitude": 20.4781,
  "scale": 0.5
}, {
  "svgPath": targetSVG,
  "title": "Bratislava",
  "latitude": 48.2116,
  "longitude": 17.1547,
  "scale": 0.5
}, {
  "svgPath": targetSVG,
  "title": "Ljubljana",
  "latitude": 46.0514,
  "longitude": 14.5060,
  "scale": 0.5
}, {
  "svgPath": targetSVG,
  "title": "Madrid",
  "latitude": 40.4167,
  "longitude": -3.7033,
  "scale": 0.5
}, {
  "svgPath": targetSVG,
  "title": "Stockholm",
  "latitude": 59.3328,
  "longitude": 18.0645,
  "scale": 0.5
}, {
  "svgPath": targetSVG,
  "title": "Bern",
  "latitude": 46.9480,
  "longitude": 7.4481,
  "scale": 0.5
}, {
  "svgPath": targetSVG,
  "title": "Kiev",
  "latitude": 50.4422,
  "longitude": 30.5367,
  "scale": 0.5
}, {
  "svgPath": targetSVG,
  "title": "Paris",
  "latitude": 48.8567,
  "longitude": 2.3510,
  "scale": 0.5
}, {
  "svgPath": targetSVG,
  "title": "New York",
  "latitude": 40.43,
  "longitude": -74,
  "scale": 0.5
} ];

// Add lines
var lineSeries = chart.series.push(new am4maps.MapLineSeries());
lineSeries.dataFields.multiGeoLine = "multiGeoLine";

var lineTemplate = lineSeries.mapLines.template;
lineTemplate.nonScalingStroke = true;
lineTemplate.arrow.nonScaling = true;
lineTemplate.arrow.width = 4;
lineTemplate.arrow.height = 6;
lineTemplate.stroke = interfaceColors.getFor("alternativeBackground");
lineTemplate.fill = interfaceColors.getFor("alternativeBackground");
lineTemplate.line.strokeOpacity = 0.4;

lineSeries.data = [{
  "multiGeoLine": [
    [
      { "latitude": 51.5002, "longitude": -0.1262 },
      { "latitude": 50.4422, "longitude": 30.5367 }
    ]
  ]
}, {
  "multiGeoLine": [
    [
      { "latitude": 51.5002, "longitude": -0.1262 },
      { "latitude": 40.4300, "longitude": -74.0000 }
    ]
  ]
}, {
  "multiGeoLine": [
    [
      { "latitude": 51.5002, "longitude": -0.1262 },
      { "latitude": 64.1353, "longitude": -21.8952 }
    ]
  ]
}, {
  "multiGeoLine": [
    [
      { "latitude": 51.5002, "longitude": -0.1262 },
      { "latitude": 37.9792, "longitude": 23.7166 }
    ]
  ]
}, {
  "multiGeoLine": [
    [
      { "latitude": 51.5002, "longitude": -0.1262 },
      { "latitude": 38.7072, "longitude": -9.1355 }
    ]
  ]
}, {
  "multiGeoLine": [
    [
      { "latitude": 51.5002, "longitude": -0.1262 },
      { "latitude": 55.7558, "longitude": 37.6176 }
    ]
  ]
}, {
  "multiGeoLine": [
    [
      { "latitude": 51.5002, "longitude": -0.1262 },
      { "latitude": 44.8048, "longitude": 20.4781 }
    ]
  ]
}, {
  "multiGeoLine": [
    [
      { "latitude": 51.5002, "longitude": -0.1262 },
      { "latitude": 48.2116, "longitude": 17.1547 }
    ]
  ]
}, {
  "multiGeoLine": [
    [
      { "latitude": 51.5002, "longitude": -0.1262 },
      { "latitude": 46.0514, "longitude": 14.5060 }
    ]
  ]
}, {
  "multiGeoLine": [
    [
      { "latitude": 51.5002, "longitude": -0.1262 },
      { "latitude": 40.4167, "longitude": -3.7033 }
    ]
  ]
}, {
  "multiGeoLine": [
    [
      { "latitude": 51.5002, "longitude": -0.1262 },
      { "latitude": 59.3328, "longitude": 18.0645 }
    ]
  ]
}, {
  "multiGeoLine": [
    [
      { "latitude": 51.5002, "longitude": -0.1262 },
      { "latitude": 46.9480, "longitude": 7.4481 }
    ]
  ]
}];

}); // end am4core.ready()
</script>

<!-- HTML -->
<div id="chartdiv"></div>