JavaScript TypeScript / ES6 ...
<style >
#chartdiv {
width : 100% ;
height : 500px ;
overflow : hidden;
}
</style >
<script src ="https://cdn.amcharts.com/lib/4/core.js" > </script >
<script src ="https://cdn.amcharts.com/lib/4/maps.js" > </script >
<script src ="https://cdn.amcharts.com/lib/4/geodata/worldLow.js" > </script >
<script src ="https://cdn.amcharts.com/lib/4/themes/animated.js" > </script >
<script >
am4core.ready (function (useTheme (am4themes_animated);
var chart = am4core.create ("chartdiv" , am4maps.MapChart );
chart.geodata = am4geodata_worldLow;
chart.projection = new am4maps.projections .Miller ();
var polygonSeries = chart.series .push (new am4maps.MapPolygonSeries ());
polygonSeries.exclude = ["AQ" ];
polygonSeries.useGeodata = true ;
var polygonTemplate = polygonSeries.mapPolygons .template ;
polygonTemplate.tooltipText = "{name}" ;
polygonTemplate.polygon .fillOpacity = 0.6 ;
var hs = polygonTemplate.states .create ("hover" );
hs.properties .fill = chart.colors .getIndex (0 );
var imageSeries = chart.series .push (new am4maps.MapImageSeries ());
imageSeries.mapImages .template .propertyFields .longitude = "longitude" ;
imageSeries.mapImages .template .propertyFields .latitude = "latitude" ;
imageSeries.mapImages .template .tooltipText = "{title}" ;
imageSeries.mapImages .template .propertyFields .url = "url" ;
var circle = imageSeries.mapImages .template .createChild (am4core.Circle );
circle.radius = 3 ;
circle.propertyFields .fill = "color" ;
circle.nonScaling = true ;
var circle2 = imageSeries.mapImages .template .createChild (am4core.Circle );
circle2.radius = 3 ;
circle2.propertyFields .fill = "color" ;
circle2.events .on ("inited" , function (event ){
animateBullet (event.target );
})
function animateBullet (circle ) {
var animation = circle.animate ([{ property : "scale" , from : 1 / chart.zoomLevel , to : 5 / chart.zoomLevel }, { property : "opacity" , from : 1 , to : 0 }], 1000 , am4core.ease .circleOut );
animation.events .on ("animationended" , function (event ){
animateBullet (event.target .object );
})
}
var colorSet = new am4core.ColorSet ();
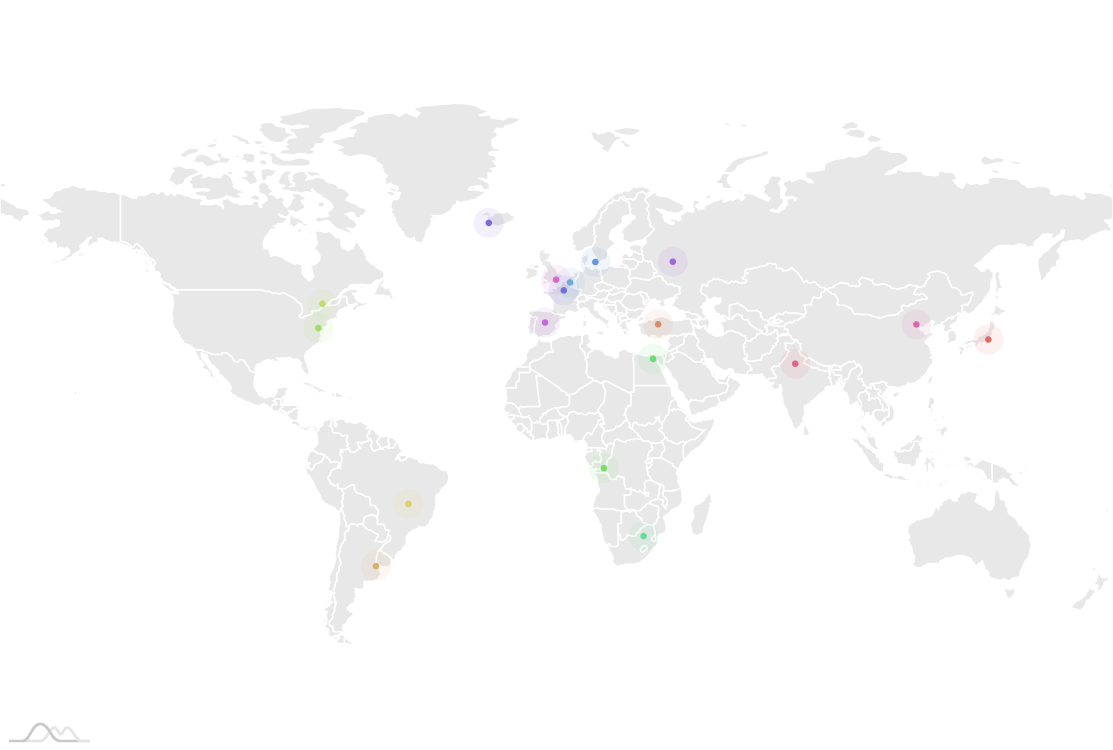
imageSeries.data = [ {
"title" : "Brussels" ,
"latitude" : 50.8371 ,
"longitude" : 4.3676 ,
"color" :colorSet.next ()
}, {
"title" : "Copenhagen" ,
"latitude" : 55.6763 ,
"longitude" : 12.5681 ,
"color" :colorSet.next ()
}, {
"title" : "Paris" ,
"latitude" : 48.8567 ,
"longitude" : 2.3510 ,
"color" :colorSet.next ()
}, {
"title" : "Reykjavik" ,
"latitude" : 64.1353 ,
"longitude" : -21.8952 ,
"color" :colorSet.next ()
}, {
"title" : "Moscow" ,
"latitude" : 55.7558 ,
"longitude" : 37.6176 ,
"color" :colorSet.next ()
}, {
"title" : "Madrid" ,
"latitude" : 40.4167 ,
"longitude" : -3.7033 ,
"color" :colorSet.next ()
}, {
"title" : "London" ,
"latitude" : 51.5002 ,
"longitude" : -0.1262 ,
"url" : "http://www.google.co.uk" ,
"color" :colorSet.next ()
}, {
"title" : "Peking" ,
"latitude" : 39.9056 ,
"longitude" : 116.3958 ,
"color" :colorSet.next ()
}, {
"title" : "New Delhi" ,
"latitude" : 28.6353 ,
"longitude" : 77.2250 ,
"color" :colorSet.next ()
}, {
"title" : "Tokyo" ,
"latitude" : 35.6785 ,
"longitude" : 139.6823 ,
"url" : "http://www.google.co.jp" ,
"color" :colorSet.next ()
}, {
"title" : "Ankara" ,
"latitude" : 39.9439 ,
"longitude" : 32.8560 ,
"color" :colorSet.next ()
}, {
"title" : "Buenos Aires" ,
"latitude" : -34.6118 ,
"longitude" : -58.4173 ,
"color" :colorSet.next ()
}, {
"title" : "Brasilia" ,
"latitude" : -15.7801 ,
"longitude" : -47.9292 ,
"color" :colorSet.next ()
}, {
"title" : "Ottawa" ,
"latitude" : 45.4235 ,
"longitude" : -75.6979 ,
"color" :colorSet.next ()
}, {
"title" : "Washington" ,
"latitude" : 38.8921 ,
"longitude" : -77.0241 ,
"color" :colorSet.next ()
}, {
"title" : "Kinshasa" ,
"latitude" : -4.3369 ,
"longitude" : 15.3271 ,
"color" :colorSet.next ()
}, {
"title" : "Cairo" ,
"latitude" : 30.0571 ,
"longitude" : 31.2272 ,
"color" :colorSet.next ()
}, {
"title" : "Pretoria" ,
"latitude" : -25.7463 ,
"longitude" : 28.1876 ,
"color" :colorSet.next ()
} ];
});
</script >
<div id ="chartdiv" > </div >
import * as am4core from "@amcharts/amcharts4/core" ;
import * as am4maps from "@amcharts/amcharts4/maps" ;
import am4geodata_worldLow from "@amcharts/amcharts4-geodata/worldLow" ;
import am4themes_animated from "@amcharts/amcharts4/themes/animated" ;
am4core.useTheme (am4themes_animated);
let chart = am4core.create ("chartdiv" , am4maps.MapChart );
chart.geodata = am4geodata_worldLow;
chart.projection = new am4maps.projections .Miller ();
let polygonSeries = chart.series .push (new am4maps.MapPolygonSeries ());
polygonSeries.exclude = ["AQ" ];
polygonSeries.useGeodata = true ;
let polygonTemplate = polygonSeries.mapPolygons .template ;
polygonTemplate.tooltipText = "{name}" ;
polygonTemplate.polygon .fillOpacity = 0.6 ;
let hs = polygonTemplate.states .create ("hover" );
hs.properties .fill = chart.colors .getIndex (0 );
let imageSeries = chart.series .push (new am4maps.MapImageSeries ());
imageSeries.mapImages .template .propertyFields .longitude = "longitude" ;
imageSeries.mapImages .template .propertyFields .latitude = "latitude" ;
imageSeries.mapImages .template .tooltipText = "{title}" ;
imageSeries.mapImages .template .propertyFields .url = "url" ;
let circle = imageSeries.mapImages .template .createChild (am4core.Circle );
circle.radius = 3 ;
circle.propertyFields .fill = "color" ;
circle.nonScaling = true ;
let circle2 = imageSeries.mapImages .template .createChild (am4core.Circle );
circle2.radius = 3 ;
circle2.propertyFields .fill = "color" ;
circle2.events .on ("inited" , function (event ){
animateBullet (event.target );
})
function animateBullet (circle ) {
let animation = circle.animate ([{ property : "scale" , from : 1 / chart.zoomLevel , to : 5 / chart.zoomLevel }, { property : "opacity" , from : 1 , to : 0 }], 1000 , am4core.ease .circleOut );
animation.events .on ("animationended" , function (event ){
animateBullet (event.target .object );
})
}
let colorSet = new am4core.ColorSet ();
imageSeries.data = [ {
"title" : "Brussels" ,
"latitude" : 50.8371 ,
"longitude" : 4.3676 ,
"color" :colorSet.next ()
}, {
"title" : "Copenhagen" ,
"latitude" : 55.6763 ,
"longitude" : 12.5681 ,
"color" :colorSet.next ()
}, {
"title" : "Paris" ,
"latitude" : 48.8567 ,
"longitude" : 2.3510 ,
"color" :colorSet.next ()
}, {
"title" : "Reykjavik" ,
"latitude" : 64.1353 ,
"longitude" : -21.8952 ,
"color" :colorSet.next ()
}, {
"title" : "Moscow" ,
"latitude" : 55.7558 ,
"longitude" : 37.6176 ,
"color" :colorSet.next ()
}, {
"title" : "Madrid" ,
"latitude" : 40.4167 ,
"longitude" : -3.7033 ,
"color" :colorSet.next ()
}, {
"title" : "London" ,
"latitude" : 51.5002 ,
"longitude" : -0.1262 ,
"url" : "http://www.google.co.uk" ,
"color" :colorSet.next ()
}, {
"title" : "Peking" ,
"latitude" : 39.9056 ,
"longitude" : 116.3958 ,
"color" :colorSet.next ()
}, {
"title" : "New Delhi" ,
"latitude" : 28.6353 ,
"longitude" : 77.2250 ,
"color" :colorSet.next ()
}, {
"title" : "Tokyo" ,
"latitude" : 35.6785 ,
"longitude" : 139.6823 ,
"url" : "http://www.google.co.jp" ,
"color" :colorSet.next ()
}, {
"title" : "Ankara" ,
"latitude" : 39.9439 ,
"longitude" : 32.8560 ,
"color" :colorSet.next ()
}, {
"title" : "Buenos Aires" ,
"latitude" : -34.6118 ,
"longitude" : -58.4173 ,
"color" :colorSet.next ()
}, {
"title" : "Brasilia" ,
"latitude" : -15.7801 ,
"longitude" : -47.9292 ,
"color" :colorSet.next ()
}, {
"title" : "Ottawa" ,
"latitude" : 45.4235 ,
"longitude" : -75.6979 ,
"color" :colorSet.next ()
}, {
"title" : "Washington" ,
"latitude" : 38.8921 ,
"longitude" : -77.0241 ,
"color" :colorSet.next ()
}, {
"title" : "Kinshasa" ,
"latitude" : -4.3369 ,
"longitude" : 15.3271 ,
"color" :colorSet.next ()
}, {
"title" : "Cairo" ,
"latitude" : 30.0571 ,
"longitude" : 31.2272 ,
"color" :colorSet.next ()
}, {
"title" : "Pretoria" ,
"latitude" : -25.7463 ,
"longitude" : 28.1876 ,
"color" :colorSet.next ()
} ];