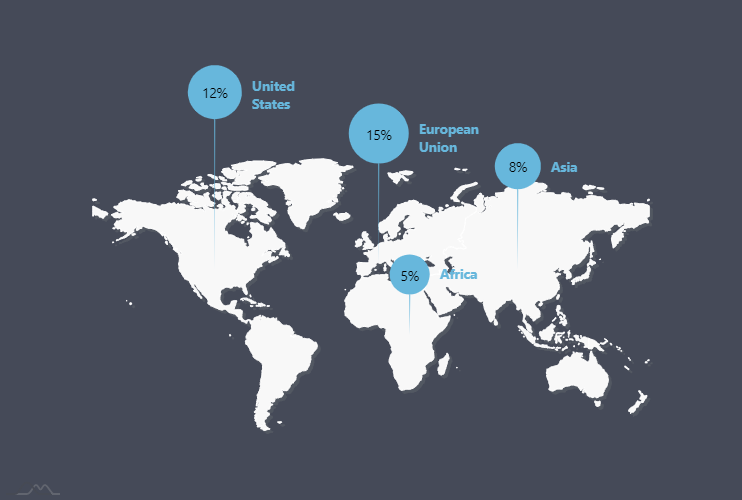
Map with sized pin bullets
This demo makes use of two complimentary features: Bullets Plugin and Heat Rules.
More about Bullets Plugin More about Heat Rules
Demo source
<!-- Styles -->
<style>
#chartdiv {
  width: 100%;
  height: 400px;
  max-width:100%;
  background-color:#454a58;
}
</style>

<!-- Resources -->
<script src="https://www.amcharts.com/lib/4/core.js"></script>
<script src="https://www.amcharts.com/lib/4/maps.js"></script>
<script src="https://www.amcharts.com/lib/4/geodata/continentsLow.js"></script>
<script src="https://www.amcharts.com/lib/4/plugins/bullets.js"></script>

<!-- Chart code -->
<script>
// Themes begin
// Using default theme
am4core.useTheme(am4themes_animated);
// Themes end

// Create map instance
var chart = am4core.create("chartdiv", am4maps.MapChart);
chart.geodata = am4geodata_continentsLow;
chart.projection = new am4maps.projections.Miller();

// Colors
var color1 = chart.colors.getIndex(0);

chart.homeGeoPoint = {
	latitude: 50,
	longitude: 0
}
chart.homeZoomLevel = 0.75;
chart.minZoomLevel = 0.75;

// Create map polygon series
var polygonSeries = chart.series.push(new am4maps.MapPolygonSeries());
polygonSeries.exclude = ["antarctica"];
polygonSeries.useGeodata = true;

// Configure series
var polygonTemplate = polygonSeries.mapPolygons.template;
polygonTemplate.fill = am4core.color("#f8f8f8");

// Add shadow
var shadow = polygonSeries.filters.push(new am4core.DropShadowFilter());
shadow.color = am4core.color("#60666b");
shadow.blur = 0;

// Pins
var imageSeries = chart.series.push(new am4maps.MapImageSeries());
var imageTemplate = imageSeries.mapImages.template;
imageTemplate.propertyFields.longitude = "longitude";
imageTemplate.propertyFields.latitude = "latitude";
imageTemplate.nonScaling = true;

// Creating a pin bullet
var pin = imageTemplate.createChild(am4plugins_bullets.PinBullet);

// Configuring pin appearance
pin.background.fill = color1;
pin.background.pointerBaseWidth = 1;
pin.background.pointerLength = 250;
pin.background.propertyFields.pointerLength = "length";
pin.circle.fill = pin.background.fill;
pin.label = new am4core.Label();
pin.label.text = "{value}%";
pin.label.fill = color1.alternate;

var label = pin.createChild(am4core.Label);
label.text = "{title}";
label.fontWeight = "bold";
label.propertyFields.dy = "length";
label.verticalCenter = "middle";
label.fill = color1;
label.adapter.add("dy", function(dy) {
	return (20 + dy) * -1;
});

// Creating a "heat rule" to modify "radius" of the bullet based
// on value in data
imageSeries.heatRules.push({
  "target": pin.background,
  "property": "radius",
  "min": 20,
  "max": 30,
  "dataField": "value"
});

imageSeries.heatRules.push({
  "target": label,
  "property": "dx",
  "min": 30,
  "max": 40,
  "dataField": "value"
});

imageSeries.heatRules.push({
  "target": label,
  "property": "paddingBottom",
  "min": 0,
  "max": 10,
  "dataField": "value"
});

// Pin data
imageSeries.data = [{
  "latitude": 40,
  "longitude": -101,
  "value": 12,
  "title": "United\nStates",
  "length": 150
}, {
  "latitude": 0,
  "longitude": 25,
  "value": 5,
  "title": "Africa",
  "length": 40
}, {
  "latitude": 43,
  "longitude": 5,
  "value": 15,
  "title": "European\nUnion",
  "length": 100
}, {
  "latitude": 40,
  "longitude": 95,
  "value": 8,
  "title": "Asia",
  "length": 80
}];
</script>

<!-- HTML -->
<div id="chartdiv"></div>