Multiple Date Axes
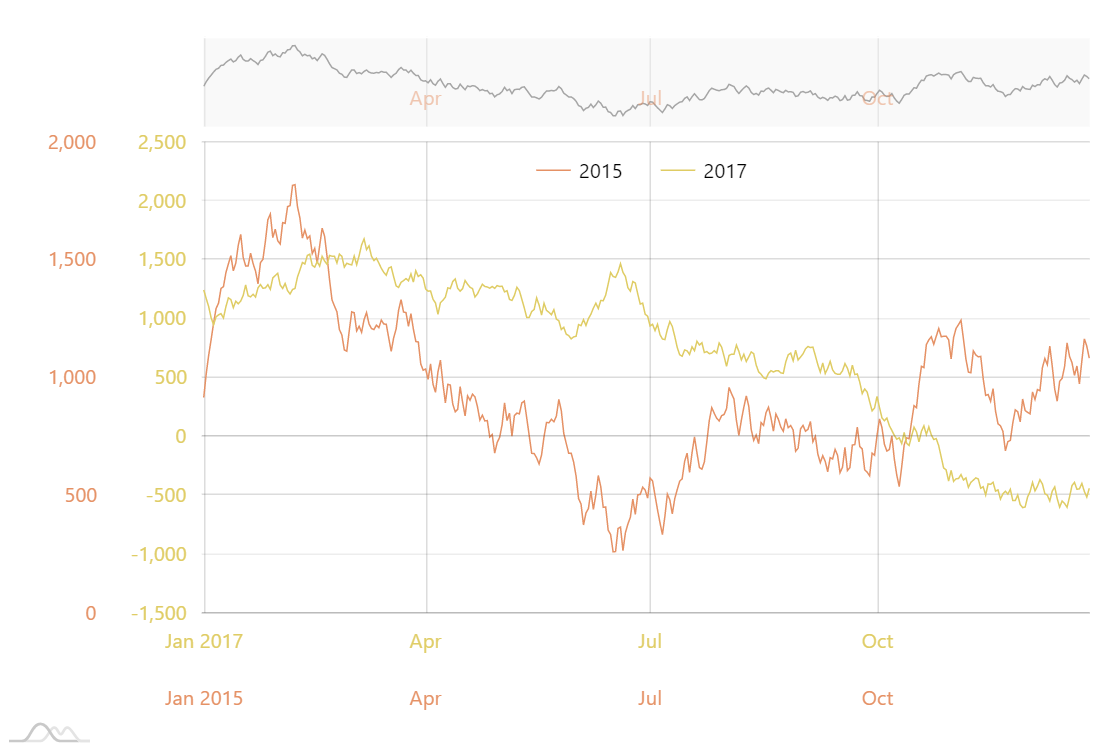
Multiple axes
amCharts 4 allows adding multiple axes of any type in any direction.
This demo shows comparison of two line series from different periods.
Synchronized axis grid
The chart can automatically synchronize grid of multiple value axes with a simple setting.
Demo source
<!-- Styles -->
<style>
#chartdiv {
  width: 100%;
  height: 500px;
}

</style>

<!-- Resources -->
<script src="https://cdn.amcharts.com/lib/4/core.js"></script>
<script src="https://cdn.amcharts.com/lib/4/charts.js"></script>
<script src="https://cdn.amcharts.com/lib/4/themes/animated.js"></script>

<!-- Chart code -->
<script>
am4core.ready(function() {

// Themes begin
am4core.useTheme(am4themes_animated);
// Themes end

// Create chart
var chart = am4core.create("chartdiv", am4charts.XYChart);

var data = [];
var price1 = 1000, price2 = 1200;
var quantity = 30000;
for (var i = 0; i < 360; i++) {
  price1 += Math.round((Math.random() < 0.5 ? 1 : -1) * Math.random() * 100);
  data.push({ date1: new Date(2015, 0, i), price1: price1 });
}
for (var i = 0; i < 360; i++) {
  price2 += Math.round((Math.random() < 0.5 ? 1 : -1) * Math.random() * 100);
  data.push({ date2: new Date(2017, 0, i), price2: price2 });
}

chart.data = data;

var dateAxis = chart.xAxes.push(new am4charts.DateAxis());
dateAxis.renderer.grid.template.location = 0;
dateAxis.renderer.labels.template.fill = am4core.color("#e59165");

var dateAxis2 = chart.xAxes.push(new am4charts.DateAxis());
dateAxis2.renderer.grid.template.location = 0;
dateAxis2.renderer.labels.template.fill = am4core.color("#dfcc64");

var valueAxis = chart.yAxes.push(new am4charts.ValueAxis());
valueAxis.tooltip.disabled = true;
valueAxis.renderer.labels.template.fill = am4core.color("#e59165");

valueAxis.renderer.minWidth = 60;

var valueAxis2 = chart.yAxes.push(new am4charts.ValueAxis());
valueAxis2.tooltip.disabled = true;
valueAxis2.renderer.labels.template.fill = am4core.color("#dfcc64");
valueAxis2.renderer.minWidth = 60;
valueAxis2.syncWithAxis = valueAxis;

var series = chart.series.push(new am4charts.LineSeries());
series.name = "2015";
series.dataFields.dateX = "date1";
series.dataFields.valueY = "price1";
series.tooltipText = "{valueY.value}";
series.fill = am4core.color("#e59165");
series.stroke = am4core.color("#e59165");
//series.strokeWidth = 3;

var series2 = chart.series.push(new am4charts.LineSeries());
series2.name = "2017";
series2.dataFields.dateX = "date2";
series2.dataFields.valueY = "price2";
series2.yAxis = valueAxis2;
series2.xAxis = dateAxis2;
series2.tooltipText = "{valueY.value}";
series2.fill = am4core.color("#dfcc64");
series2.stroke = am4core.color("#dfcc64");
//series2.strokeWidth = 3;

chart.cursor = new am4charts.XYCursor();
chart.cursor.xAxis = dateAxis2;

var scrollbarX = new am4charts.XYChartScrollbar();
scrollbarX.series.push(series);
chart.scrollbarX = scrollbarX;

chart.legend = new am4charts.Legend();
chart.legend.parent = chart.plotContainer;
chart.legend.zIndex = 100;

valueAxis2.renderer.grid.template.strokeOpacity = 0.07;
dateAxis2.renderer.grid.template.strokeOpacity = 0.07;
dateAxis.renderer.grid.template.strokeOpacity = 0.07;
valueAxis.renderer.grid.template.strokeOpacity = 0.07;

}); // end am4core.ready()
</script>

<!-- HTML -->
<div id="chartdiv"></div>