Nested donut chart
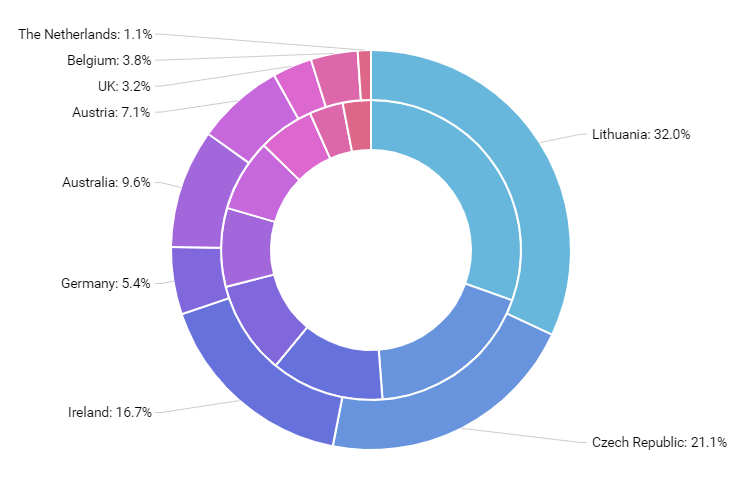
Nested donut chart (also known as Multi-level doughnut chart, Multi-series doughnut chart) allows you to display multiple series in a single visualization. The series are usually related but represent different categories or slices of data (like the distribution of some category values over different years, etc.)
Support for multiple series
You can add any number of pie series to the pie chart. The chart will automatically nest them dividing available radius between each series, creating nested donuts.
More about nested donut charts
Demo source
<!-- Styles -->
<style>
#chartdiv {
  width: 100%;
  height: 500px;
}

</style>

<!-- Resources -->
<script src="https://cdn.amcharts.com/lib/4/core.js"></script>
<script src="https://cdn.amcharts.com/lib/4/charts.js"></script>
<script src="https://cdn.amcharts.com/lib/4/themes/animated.js"></script>

<!-- Chart code -->
<script>
am4core.ready(function() {

// Themes begin
am4core.useTheme(am4themes_animated);
// Themes end

// Create chart instance
var chart = am4core.create("chartdiv", am4charts.PieChart);

// Let's cut a hole in our Pie chart the size of 40% the radius
chart.innerRadius = am4core.percent(40);

// Add data
chart.data = [{
  "country": "Lithuania",
  "litres": 501.9,
  "bottles": 1500
}, {
  "country": "Czech Republic",
  "litres": 301.9,
  "bottles": 990
}, {
  "country": "Ireland",
  "litres": 201.1,
  "bottles": 785
}, {
  "country": "Germany",
  "litres": 165.8,
  "bottles": 255
}, {
  "country": "Australia",
  "litres": 139.9,
  "bottles": 452
}, {
  "country": "Austria",
  "litres": 128.3,
  "bottles": 332
}, {
  "country": "UK",
  "litres": 99,
  "bottles": 150
}, {
  "country": "Belgium",
  "litres": 60,
  "bottles": 178
}, {
  "country": "The Netherlands",
  "litres": 50,
  "bottles": 50
}];

// Add and configure Series
var pieSeries = chart.series.push(new am4charts.PieSeries());
pieSeries.dataFields.value = "litres";
pieSeries.dataFields.category = "country";
pieSeries.slices.template.stroke = am4core.color("#fff");
pieSeries.slices.template.strokeWidth = 2;
pieSeries.slices.template.strokeOpacity = 1;

// Disabling labels and ticks on inner circle
pieSeries.labels.template.disabled = true;
pieSeries.ticks.template.disabled = true;

// Disable sliding out of slices
pieSeries.slices.template.states.getKey("hover").properties.shiftRadius = 0;
pieSeries.slices.template.states.getKey("hover").properties.scale = 0.9;

// Add second series
var pieSeries2 = chart.series.push(new am4charts.PieSeries());
pieSeries2.dataFields.value = "bottles";
pieSeries2.dataFields.category = "country";
pieSeries2.slices.template.stroke = am4core.color("#fff");
pieSeries2.slices.template.strokeWidth = 2;
pieSeries2.slices.template.strokeOpacity = 1;
pieSeries2.slices.template.states.getKey("hover").properties.shiftRadius = 0;
pieSeries2.slices.template.states.getKey("hover").properties.scale = 1.1;

}); // end am4core.ready()
</script>

<!-- HTML -->
<div id="chartdiv"></div>