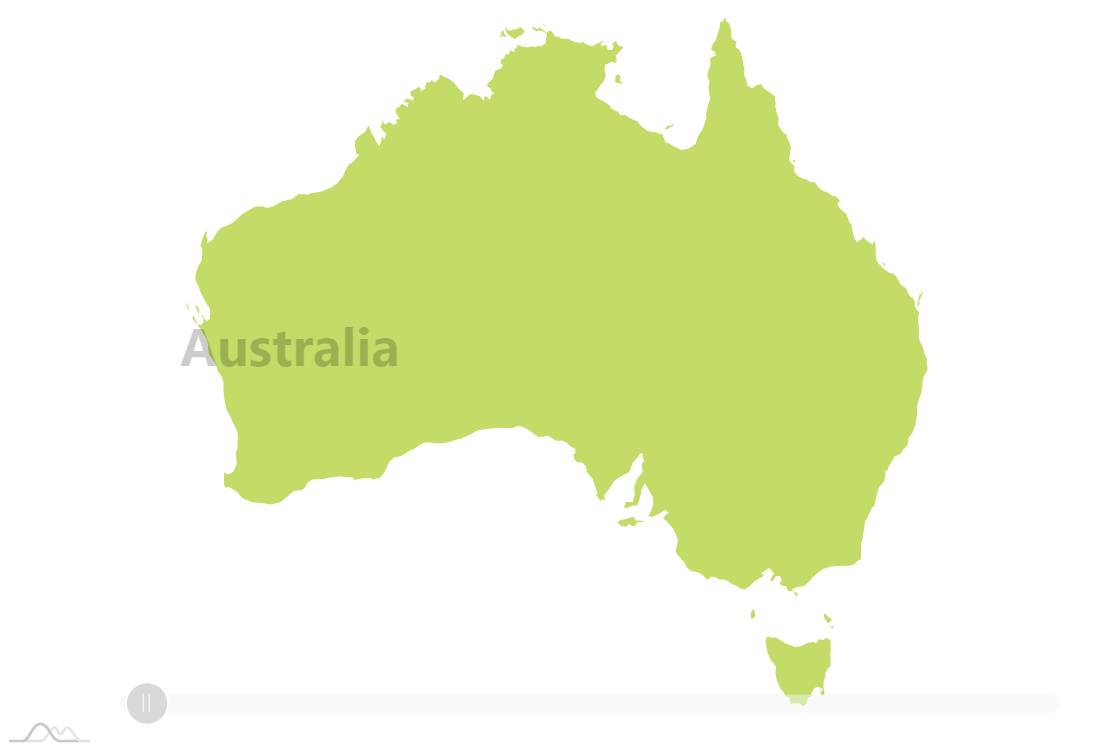
One Country morphing to another
Implement visually stunning geographic reports with amCharts 4 and a little bit of magic. Check out the source code below and this tutorial for guidance on how to implement similar effects in your own visualizations.
Demo source
<!-- Styles -->
<style>
#chartdiv {
  width: 100%;
  max-width:100%;
  height: 500px;
}

#hiddenchartdiv{
  width: 100%;
  max-width:100%;
  height: 500px;
  visibility:hidden;
  position:absolute;
  top:0px;
}
</style>

<!-- Resources -->
<script src="https://cdn.amcharts.com/lib/4/core.js"></script>
<script src="https://cdn.amcharts.com/lib/4/maps.js"></script>
<script src="https://cdn.amcharts.com/lib/4/geodata/worldHigh.js"></script>
<script src="https://cdn.amcharts.com/lib/4/themes/animated.js"></script>

<!-- Chart code -->
<script>
am4core.ready(function() {

// Themes begin
am4core.useTheme(am4themes_animated);
// Themes end


var countryCodes = ["AF", "AO", "AR", "AM", "AU", "AT", "AZ", "BD", "BY", "BE", "BO", "BA", "BW", "BR", "BG", "KH", "CM", "CA", "CF", "TD", "CL", "CN", "CO", "CG", "CD", "CR", "CI", "HR", "CU", "CY", "CZ", "DK", "EC", "EG", "ER", "EE", "ET", "FI", "FR", "GE", "DE", "GR", "GL", "GP", "GT", "GN", "GW", "GY", "HT", "HN", "HU", "IS", "IN", "ID", "IR", "IQ", "IE", "IL", "IT", "JM", "JP", "JO", "KZ", "KE", "KP", "KR", "KG", "LA", "LV", "LB", "LS", "LR", "LY", "LT", "LU", "MK", "MG", "MY", "ML", "MT", "MR", "MX", "MD", "MN", "ME", "MA", "MZ", "MM", "NA", "NP", "NL", "NZ", "NI", "NE", "NG", "NO", "OM", "PK", "PA", "PG", "PY", "PE", "PH", "PL", "PT", "RO", "RU", "SA", "SN", "RS", "SK", "SI", "SO", "ZA", "SS", "ES", "SD", "SE", "CH", "SY", "TW", "TJ", "TZ", "TH", "TN", "TR", "TM", "UA", "AE", "GB", "US", "UY", "UZ", "VE", "VN", "YE", "ZM", "ZW"];

var chart = am4core.create("chartdiv", am4maps.MapChart);


try {
	chart.geodata = am4geodata_worldHigh;
}
catch (e) {
	chart.raiseCriticalError(new Error("Map geodata could not be loaded. Please download the latest <a href=\"https://www.amcharts.com/download/download-v4/\">amcharts geodata</a> and extract its contents into the same directory as your amCharts files."));
}

chart.projection = new am4maps.projections.Mercator();
chart.padding(10, 20, 10, 20);
chart.minZoomLevel = 0.9;
chart.zoomLevel = 0.9;
chart.maxZoomLevel = 1;

var polygonSeries = chart.series.push(new am4maps.MapPolygonSeries());
polygonSeries.useGeodata = true;
polygonSeries.include = ["AF"];


var chart1 = am4core.create("hiddenchartdiv", am4maps.MapChart);
chart1.padding(10, 20, 10, 20);
chart1.geodata = am4geodata_worldHigh;
chart1.projection = new am4maps.projections.Mercator();

var polygonSeries1 = chart1.series.push(new am4maps.MapPolygonSeries());
polygonSeries1.useGeodata = true;
polygonSeries1.include = ["AF"];


var label = chart.chartContainer.createChild(am4core.Label);
label.x = 100;
label.y = 100;
label.fill = am4core.color("#000000");
label.fontSize = 35;
label.fontWeight = "bold";
label.text = "Afghanistan";
label.fillOpacity = 0.2;

var slider = chart.createChild(am4core.Slider);
slider.padding(0, 15, 0, 60);
slider.background.padding(0, 15, 0, 60);
slider.marginBottom = 15;
slider.valign = "bottom";

var currentIndex = -1;
var colorset = new am4core.ColorSet();

setInterval(function () {
	var next = slider.start + 1 / countryCodes.length;
	if (next >= 1) {
		next = 0;
	}
	slider.animate({ property: "start", to: next }, 300);
}, 2000)

slider.events.on("rangechanged", function () {
	changeCountry();
})

function changeCountry() {
	var totalCountries = countryCodes.length - 1;
	var countryIndex = Math.round(totalCountries * slider.start);

	var morphToPolygon;

	if (currentIndex != countryIndex) {
		polygonSeries1.data = [];
		polygonSeries1.include = [countryCodes[countryIndex]];

		currentIndex = countryIndex;

		polygonSeries1.events.once("validated", function () {

			morphToPolygon = polygonSeries1.mapPolygons.getIndex(0);
			if(morphToPolygon){
				var countryPolygon = polygonSeries.mapPolygons.getIndex(0);

				var morpher = countryPolygon.polygon.morpher;
				var morphAnimation = morpher.morphToPolygon(morphToPolygon.polygon.points);

				var colorAnimation = countryPolygon.animate({ "property": "fill", "to": colorset.getIndex(Math.round(Math.random() * 20)) }, 1000);

				var animation = label.animate({ property: "y", to: 1000 }, 300);

				animation.events.once("animationended", function () {
					label.text = morphToPolygon.dataItem.dataContext["name"];
					label.y = -50;
					label.animate({ property: "y", to: 200 }, 300, am4core.ease.quadOut);
				})
			}
		})
	}
}


}); // end am4core.ready()
</script>

<!-- HTML -->
<div id="chartdiv"></div>
<div id="hiddenchartdiv"></div>