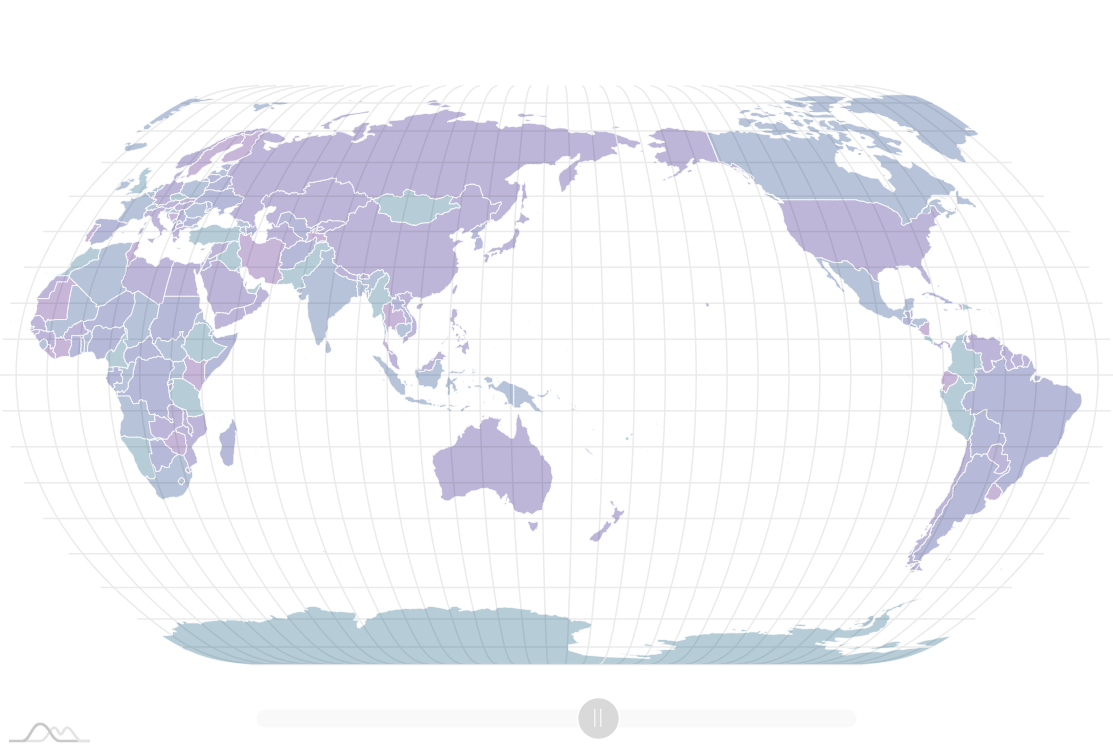
Pacific-centered map
World map in amCharts 4 can be Pacific-centered, this is useful for Asian countries which often use this kind of map. Actually you can center the map at any longitude – drag the map to change it’s center.
Demo source
<!-- Styles -->
<style>
#chartdiv {
  width: 100%;
  height: 500px;
}
</style>

<!-- Resources -->
<script src="https://cdn.amcharts.com/lib/4/core.js"></script>
<script src="https://cdn.amcharts.com/lib/4/maps.js"></script>
<script src="https://cdn.amcharts.com/lib/4/geodata/worldLow.js"></script>
<script src="https://cdn.amcharts.com/lib/4/themes/animated.js"></script>

<!-- Chart code -->
<script>
am4core.ready(function() {

// Themes begin
am4core.useTheme(am4themes_animated);
// Themes end

// Create map instance
var chart = am4core.create("chartdiv", am4maps.MapChart);

// Set map definition
chart.geodata = am4geodata_worldLow;

// Set projection
chart.projection = new am4maps.projections.NaturalEarth1();
chart.panBehavior = "rotateLong";

// Create map polygon series
var polygonSeries = chart.series.push(new am4maps.MapPolygonSeries());

// Make map load polygon (like country names) data from GeoJSON
polygonSeries.useGeodata = true;

polygonSeries.mapPolygons.template.fillOpacity = 0.6;
polygonSeries.mapPolygons.template.nonScalingStroke = true;
polygonSeries.mapPolygons.template.strokeWidth = 0.5;
polygonSeries.mapPolygons.template.adapter.add("fill", function(fill, target) {
    return chart.colors.getIndex(Math.round(Math.random() * 4)).saturate(0.3);
})

// Configure series
var polygonTemplate = polygonSeries.mapPolygons.template;
polygonTemplate.tooltipText = "{name}";

// Create hover state and set alternative fill color
var hs = polygonTemplate.states.create("hover");
hs.properties.fill = chart.colors.getIndex(1);

// Center on Pacic
chart.deltaLongitude = -154.8;


var graticuleSeries = chart.series.push(new am4maps.GraticuleSeries());
graticuleSeries.fitExtent = false;

}); // end am4core.ready()
</script>

<!-- HTML -->
<div id="chartdiv"></div>