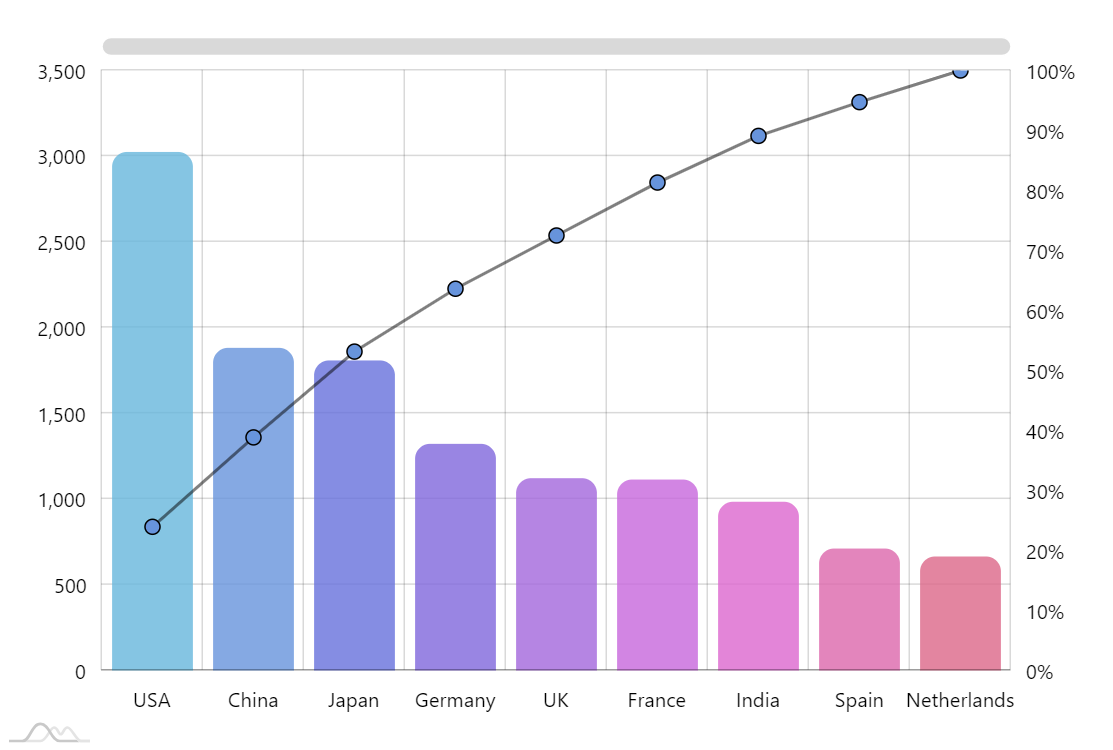
Pareto diagram
A Pareto chart or Pareto diagram, is a type of chart that contains both column and a line series, where individual values are represented in descending order by columns, and the cumulative total is represented by the line.
Demo source
<!-- Styles -->
<style>
#chartdiv {
  width: 100%;
  height: 500px;
}
</style>

<!-- Resources -->
<script src="https://cdn.amcharts.com/lib/4/core.js"></script>
<script src="https://cdn.amcharts.com/lib/4/charts.js"></script>
<script src="https://cdn.amcharts.com/lib/4/themes/animated.js"></script>

<!-- Chart code -->
<script>
am4core.ready(function() {

// Themes begin
am4core.useTheme(am4themes_animated);
// Themes end

// Create chart instance
var chart = am4core.create("chartdiv", am4charts.XYChart);
chart.scrollbarX = new am4core.Scrollbar();

// Add data
chart.data = [{
  "country": "USA",
  "visits": 3025
}, {
  "country": "China",
  "visits": 1882
}, {
  "country": "Japan",
  "visits": 1809
}, {
  "country": "Germany",
  "visits": 1322
}, {
  "country": "UK",
  "visits": 1122
}, {
  "country": "France",
  "visits": 1114
}, {
  "country": "India",
  "visits": 984
}, {
  "country": "Spain",
  "visits": 711
}, {
  "country": "Netherlands",
  "visits": 665
}];

prepareParetoData();

function prepareParetoData(){
    var total = 0;

    for(var i = 0; i < chart.data.length; i++){
        var value = chart.data[i].visits;
        total += value;
    }

    var sum = 0;
    for(var i = 0; i < chart.data.length; i++){
        var value = chart.data[i].visits;
        sum += value;
        chart.data[i].pareto = sum / total * 100;
    }
}

// Create axes
var categoryAxis = chart.xAxes.push(new am4charts.CategoryAxis());
categoryAxis.dataFields.category = "country";
categoryAxis.renderer.grid.template.location = 0;
categoryAxis.renderer.minGridDistance = 60;
categoryAxis.tooltip.disabled = true;

var valueAxis = chart.yAxes.push(new am4charts.ValueAxis());
valueAxis.renderer.minWidth = 50;
valueAxis.min = 0;
valueAxis.cursorTooltipEnabled = false;

// Create series
var series = chart.series.push(new am4charts.ColumnSeries());
series.sequencedInterpolation = true;
series.dataFields.valueY = "visits";
series.dataFields.categoryX = "country";
series.tooltipText = "[{categoryX}: bold]{valueY}[/]";
series.columns.template.strokeWidth = 0;

series.tooltip.pointerOrientation = "vertical";

series.columns.template.column.cornerRadiusTopLeft = 10;
series.columns.template.column.cornerRadiusTopRight = 10;
series.columns.template.column.fillOpacity = 0.8;

// on hover, make corner radiuses bigger
var hoverState = series.columns.template.column.states.create("hover");
hoverState.properties.cornerRadiusTopLeft = 0;
hoverState.properties.cornerRadiusTopRight = 0;
hoverState.properties.fillOpacity = 1;

series.columns.template.adapter.add("fill", function(fill, target) {
  return chart.colors.getIndex(target.dataItem.index);
})


var paretoValueAxis = chart.yAxes.push(new am4charts.ValueAxis());
paretoValueAxis.renderer.opposite = true;
paretoValueAxis.min = 0;
paretoValueAxis.max = 100;
paretoValueAxis.strictMinMax = true;
paretoValueAxis.renderer.grid.template.disabled = true;
paretoValueAxis.numberFormatter = new am4core.NumberFormatter();
paretoValueAxis.numberFormatter.numberFormat = "#'%'"
paretoValueAxis.cursorTooltipEnabled = false;

var paretoSeries = chart.series.push(new am4charts.LineSeries())
paretoSeries.dataFields.valueY = "pareto";
paretoSeries.dataFields.categoryX = "country";
paretoSeries.yAxis = paretoValueAxis;
paretoSeries.tooltipText = "pareto: {valueY.formatNumber('#.0')}%[/]";
paretoSeries.bullets.push(new am4charts.CircleBullet());
paretoSeries.strokeWidth = 2;
paretoSeries.stroke = new am4core.InterfaceColorSet().getFor("alternativeBackground");
paretoSeries.strokeOpacity = 0.5;

// Cursor
chart.cursor = new am4charts.XYCursor();
chart.cursor.behavior = "panX";

}); // end am4core.ready()
</script>

<!-- HTML -->
<div id="chartdiv"></div>