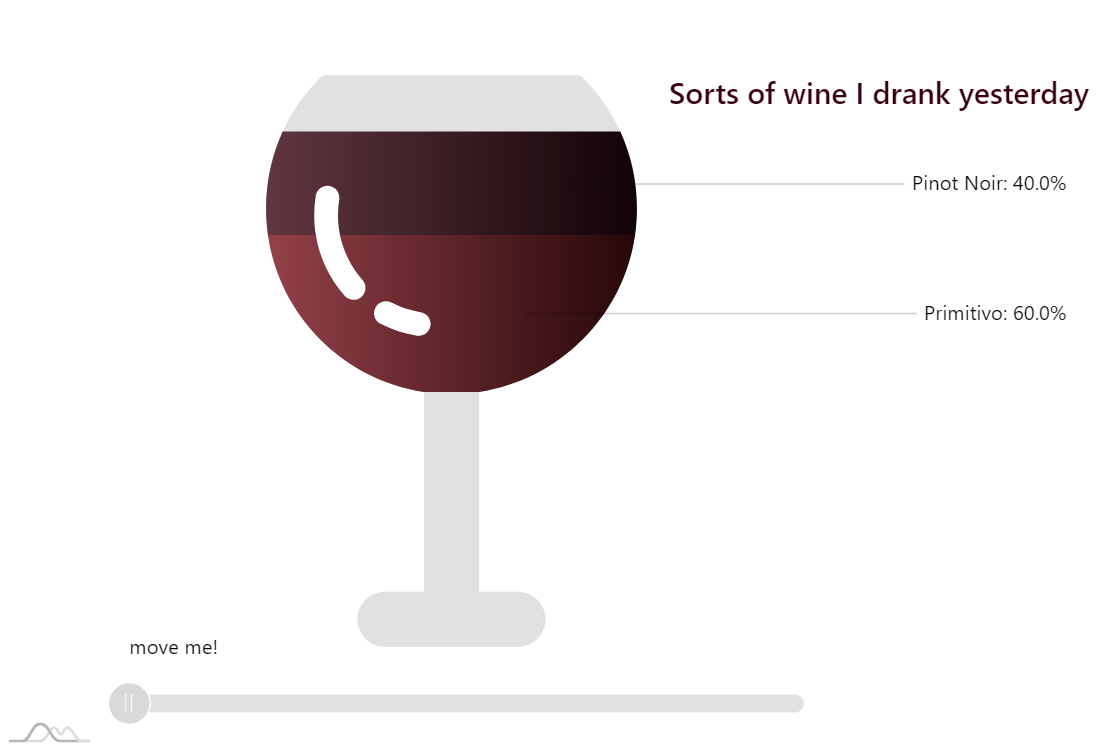
Pictorial Chart
Sometimes you might want the picture you want to use for pictorial chart not to be filled completely from bottom to the top, like this one. Our PictorialStackedSeries has startLocation and endLocation properties which help to adjust start/end locations of the fills. Try to drag the slider to do it yourself.
Demo source
<!-- Styles -->
<style>
#chartdiv {
  width: 100%;
  height: 600px;
}
</style>

<!-- Resources -->
<script src="https://cdn.amcharts.com/lib/4/core.js"></script>
<script src="https://cdn.amcharts.com/lib/4/charts.js"></script>
<script src="https://cdn.amcharts.com/lib/4/themes/animated.js"></script>

<!-- Chart code -->
<script>
am4core.ready(function() {

// Themes begin
am4core.useTheme(am4themes_animated);
// Themes end

var iconPath = "M256.814,72.75c0-26.898-10.451-52.213-29.43-71.277C226.444,0.529,225.17,0,223.84,0H87.712c-1.329,0-2.604,0.529-3.543,1.473c-18.978,19.064-29.43,44.379-29.43,71.277c0,50.615,37.414,92.654,86.037,99.922v108.88h-21.25c-8.271,0-15,6.729-15,15c0,8.271,6.729,15,15,15h72.5c8.271,0,15-6.729,15-15c0-8.271-6.729-15-15-15h-21.25v-108.88C219.399,165.404,256.814,123.365,256.814,72.75z M106.709,120.879c-1.234,1.083-2.765,1.615-4.285,1.615c-1.807,0-3.604-0.748-4.888-2.212c-13.153-14.986-18.888-34.832-15.733-54.451c0.571-3.543,3.902-5.956,7.45-5.385c3.544,0.57,5.955,3.905,5.386,7.45c-2.538,15.779,2.079,31.747,12.667,43.811C109.674,114.404,109.406,118.511,106.709,120.879z M144.351,136.662c-0.514,3.194-3.274,5.468-6.409,5.468c-0.343,0-0.69-0.027-1.041-0.083c-6.937-1.117-13.6-3.299-19.804-6.488c-3.193-1.641-4.451-5.559-2.811-8.752c1.641-3.194,5.563-4.451,8.752-2.81c4.985,2.562,10.345,4.317,15.929,5.215C142.511,129.782,144.922,133.118,144.351,136.662z";

var chart = am4core.create("chartdiv", am4charts.SlicedChart);
chart.paddingTop = am4core.percent(10);

chart.data = [{
  "name": "Pinot Noir",
  "value": 200,
  "color": am4core.color("#390511")
}, {
  "name": "Primitivo",
  "value": 300,
  "color": am4core.color("#7b131c")
}];

var series = chart.series.push(new am4charts.PictorialStackedSeries());
series.dataFields.value = "value";
series.dataFields.category = "name";
series.startLocation = 0.3
series.endLocation = 0.85

series.slicesContainer.background.fill = am4core.color("#676767")
series.slicesContainer.background.fillOpacity = 0.2;

series.maskSprite.path = iconPath;

series.labelsContainer.width = am4core.percent(100);
series.alignLabels = true;
series.slices.template.propertyFields.fill = "color";
series.slices.template.propertyFields.stroke = "color";

var gradientModifier = new am4core.LinearGradientModifier();
gradientModifier.lightnesses = [0.2, -0.7];
series.slices.template.fillModifier = gradientModifier;
series.slices.template.strokeModifier = gradientModifier;

// this makes the fills to start and end at certain location instead of taking whole picture
series.endLocation = 0.553;
series.startLocation = 0.1;
// this makes initial fill animation
series.hiddenState.properties.startLocation = 0.553;
series.ticks.template.locationX = 0.7;
series.labelsContainer.width = 120;

var sliderContainer = chart.createChild(am4core.Container);
sliderContainer.marginTop = am4core.percent(5);
sliderContainer.width = am4core.percent(80);
sliderContainer.align = "center";
sliderContainer.paddingRight = 120;


var label = sliderContainer.createChild(am4core.Label);
label.text = "move me!";
label.dy = -40;
label.isMeasured = false;

var slider = sliderContainer.createChild(am4core.Slider);
slider.start = 0;
slider.background.fill = am4core.color("#676767");
slider.background.fillOpacity = 0.2;

// doing it later for animation to finish
setTimeout(initSlider, 1500);

function initSlider(){
    slider.events.on("rangechanged", function(){
        series.startLocation = 0.1 + (0.553 - 0.1) * slider.start;
        series.dataItems.getIndex(0).value = (1 - slider.start) * 200;
        slider.background.fill = new am4core.Color(am4core.colors.interpolate(am4core.color("#676767").rgb, am4core.color("#7b131c").rgb, slider.start));
        slider.background.fillOpacity = 0.2 + slider.start * 0.8;

        blurFilter.blur = slider.start * 5;
    })
}

var title = chart.createChild(am4core.Label);
title.text = "Sorts of wine I drank yesterday"
title.fontSize = 20;
title.fill = am4core.color("#390511");
title.isMeasured = false;
title.x = am4core.percent(100);
title.horizontalCenter = "right";
title.fontWeight = "600";

let blurFilter = new am4core.BlurFilter();
blurFilter.blur = 0;
title.filters.push(blurFilter);

}); // end am4core.ready()
</script>

<!-- HTML -->
<div id="chartdiv"></div>