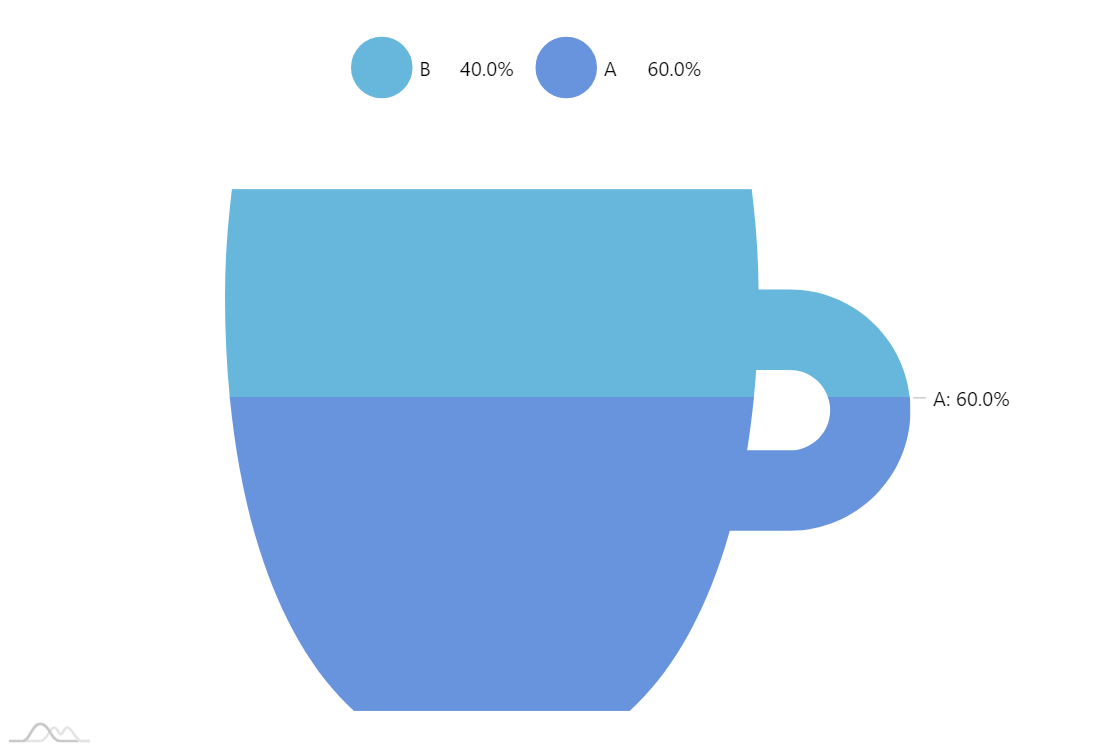
Pictorial fraction chart
Pictorial fraction chart is a great way to visualize fractions of a whole using an image depicting that whole as a visual aid. For example, you can visually demonstrate the ingredients of a product using the product’s image as a container.
Demo source
<!-- Styles -->
<style>
#chartdiv {
  width: 100%;
  height: 500px;
}

</style>

<!-- Resources -->
<script src="https://cdn.amcharts.com/lib/4/core.js"></script>
<script src="https://cdn.amcharts.com/lib/4/charts.js"></script>
<script src="https://cdn.amcharts.com/lib/4/themes/animated.js"></script>

<!-- Chart code -->
<script>
am4core.ready(function() {

// Themes begin
am4core.useTheme(am4themes_animated);
// Themes end

var iconPath = "M421.976,136.204h-23.409l-0.012,0.008c-0.19-20.728-1.405-41.457-3.643-61.704l-1.476-13.352H5.159L3.682,74.507 C1.239,96.601,0,119.273,0,141.895c0,65.221,7.788,126.69,22.52,177.761c7.67,26.588,17.259,50.661,28.5,71.548  c11.793,21.915,25.534,40.556,40.839,55.406l4.364,4.234h206.148l4.364-4.234c15.306-14.85,29.046-33.491,40.839-55.406  c11.241-20.888,20.829-44.96,28.5-71.548c0.325-1.127,0.643-2.266,0.961-3.404h44.94c49.639,0,90.024-40.385,90.024-90.024  C512,176.588,471.615,136.204,421.976,136.204z M421.976,256.252h-32c3.061-19.239,5.329-39.333,6.766-60.048h25.234  c16.582,0,30.024,13.442,30.024,30.024C452,242.81,438.558,256.252,421.976,256.252z"

var chart = am4core.create("chartdiv", am4charts.SlicedChart);
chart.hiddenState.properties.opacity = 0; // this makes initial fade in effect
chart.paddingLeft = 150;

chart.data = [{
    "name": "B",
    "value": 40,
    "disabled":true
}, {
    "name": "A",
    "value": 60
}];

var series = chart.series.push(new am4charts.PictorialStackedSeries());
series.dataFields.value = "value";
series.dataFields.category = "name";
series.alignLabels = true;
// this makes only A label to be visible
series.labels.template.propertyFields.disabled = "disabled";
series.ticks.template.propertyFields.disabled = "disabled";


series.maskSprite.path = iconPath;
series.ticks.template.locationX = 1;
series.ticks.template.locationY = 0;

series.labelsContainer.width = 100;

chart.legend = new am4charts.Legend();
chart.legend.position = "top";
chart.legend.paddingRight = 160;
chart.legend.paddingBottom = 40;
let marker = chart.legend.markers.template.children.getIndex(0);
chart.legend.markers.template.width = 40;
chart.legend.markers.template.height = 40;
marker.cornerRadius(20,20,20,20);

}); // end am4core.ready()
</script>

<!-- HTML -->
<div id="chartdiv"></div>