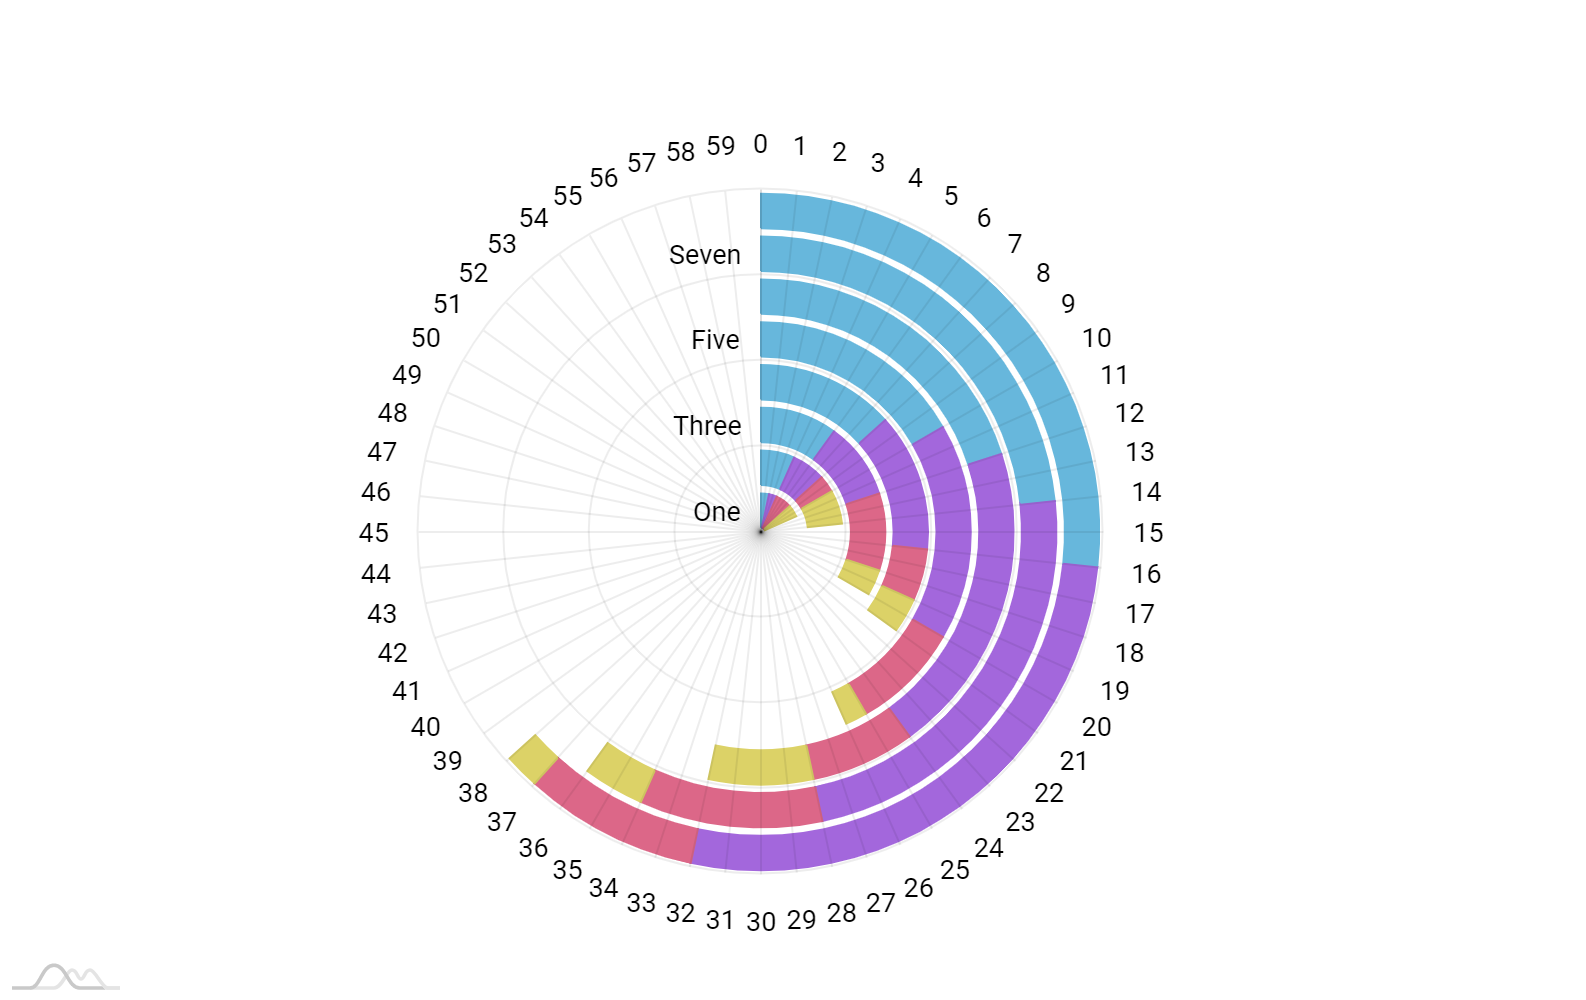
Radial bar chart
A Radial/Circular bar chart is a bar chart displayed on a polar coordinate system. The difference between radial column chart is that base axis of series is y axis of a radar chart making columns circular. You can easily adjust start/end angles of a chart by setting startAngle and endAngle of your RadarChart component.
Demo source
<!-- Styles -->
<style>
#chartdiv {
  width: 100%;
  height: 650px;
}
</style>

<!-- Resources -->
<script src="https://cdn.amcharts.com/lib/4/core.js"></script>
<script src="https://cdn.amcharts.com/lib/4/charts.js"></script>
<script src="https://cdn.amcharts.com/lib/4/themes/animated.js"></script>

<!-- Chart code -->
<script>
am4core.ready(function() {

// Themes begin
am4core.useTheme(am4themes_animated);
// Themes end

var chart = am4core.create("chartdiv", am4charts.RadarChart);
chart.hiddenState.properties.opacity = 0; // this creates initial fade-in

chart.data = [
  {
    category: "One",
    value1: 8,
    value2: 2,
    value3: 4,
    value4: 3
  },
  {
    category: "Two",
    value1: 11,
    value2: 4,
    value3: 2,
    value4: 4
  },
  {
    category: "Three",
    value1: 7,
    value2: 6,
    value3: 6,
    value4: 2
  },
  {
    category: "Four",
    value1: 13,
    value2: 8,
    value3: 3,
    value4: 2
  },
  {
    category: "Five",
    value1: 12,
    value2: 10,
    value3: 5,
    value4: 1
  },
  {
    category: "Six",
    value1: 15,
    value2: 12,
    value3: 4,
    value4: 4
  }
];

//chart.padding(20, 20, 20, 20);
chart.colors.step = 4;

var categoryAxis = chart.yAxes.push(new am4charts.CategoryAxis());
categoryAxis.dataFields.category = "category";
categoryAxis.renderer.labels.template.location = 0.5;
categoryAxis.renderer.labels.template.horizontalCenter = "right";
categoryAxis.renderer.grid.template.location = 0;
categoryAxis.renderer.tooltipLocation = 0.5;
categoryAxis.renderer.grid.template.strokeOpacity = 0.07;
categoryAxis.renderer.axisFills.template.disabled = true;
categoryAxis.interactionsEnabled = false;
categoryAxis.renderer.minGridDistance = 10;

var valueAxis = chart.xAxes.push(new am4charts.ValueAxis());
valueAxis.tooltip.disabled = true;
valueAxis.renderer.labels.template.horizontalCenter = "left";
valueAxis.min = 0;
valueAxis.max = 60;
valueAxis.strictMinMax = true;
valueAxis.renderer.maxLabelPosition = 0.99;
valueAxis.renderer.minGridDistance = 10;
valueAxis.renderer.grid.template.strokeOpacity = 0.07;
valueAxis.renderer.axisFills.template.disabled = true;
valueAxis.interactionsEnabled = false;

var series1 = chart.series.push(new am4charts.RadarColumnSeries());
series1.columns.template.tooltipText = "{name}: {valueX.value}";
series1.name = "Series 1";
series1.dataFields.categoryY = "category";
series1.dataFields.valueX = "value1";
series1.stacked = true;

var series2 = chart.series.push(new am4charts.RadarColumnSeries());
series2.columns.template.tooltipText = "{name}: {valueX.value}";
series2.name = "Series 2";
series2.dataFields.categoryY = "category";
series2.dataFields.valueX = "value2";
series2.stacked = true;

var series3 = chart.series.push(new am4charts.RadarColumnSeries());
series3.columns.template.tooltipText = "{name}: {valueX.value}";
series3.name = "Series 3";
series3.dataFields.categoryY = "category";
series3.dataFields.valueX = "value3";
series3.stacked = true;

var series4 = chart.series.push(new am4charts.RadarColumnSeries());
series4.columns.template.tooltipText = "{name}: {valueX.value}";
series4.name = "Series 4";
series4.dataFields.categoryY = "category";
series4.dataFields.valueX = "value4";
series4.stacked = true;

chart.seriesContainer.zIndex = -1;

chart.scrollbarX = new am4core.Scrollbar();
chart.scrollbarX.exportable = false;
chart.scrollbarY = new am4core.Scrollbar();
chart.scrollbarY.exportable = false;

chart.cursor = new am4charts.RadarCursor();
chart.cursor.lineY.disabled = true;

}); // end am4core.ready()
</script>

<!-- HTML -->
<div id="chartdiv"></div>