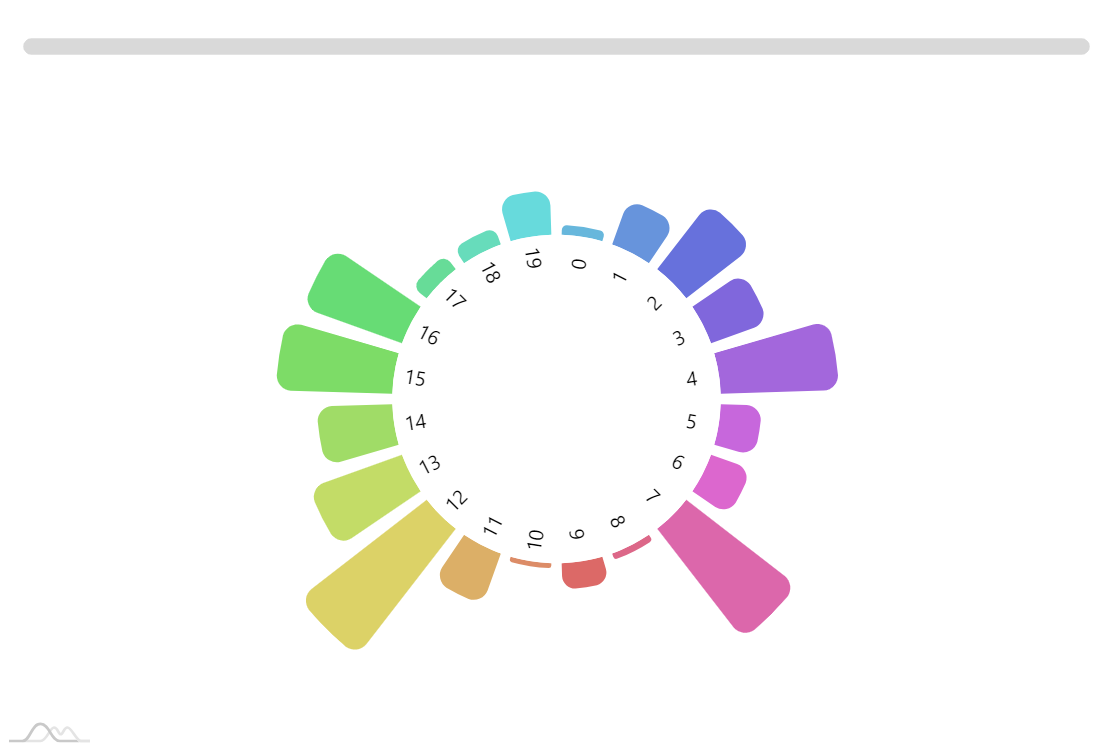
Radial Histogram
Radial Histogram (also known as Circular Histogram, Circular Bar Chart, Angular Histogram, Polar Histogram) is a variation of a bar chart where every bar is displayed along a circle. Compared to traditional linear bar charts this results in more eye-catchy visualizations with an ability to display more bars in the same space. On the negative side, these charts are harder to read and make it difficult to compare values at distant locations along the axis.
Demo source
<!-- Styles -->
<style>
#chartdiv {
  width: 100%;
  height: 500px;
}
</style>

<!-- Resources -->
<script src="https://cdn.amcharts.com/lib/4/core.js"></script>
<script src="https://cdn.amcharts.com/lib/4/charts.js"></script>
<script src="https://cdn.amcharts.com/lib/4/themes/animated.js"></script>

<!-- Chart code -->
<script>
am4core.ready(function() {

// Themes begin
am4core.useTheme(am4themes_animated);
// Themes end

// Create chart instance
var chart = am4core.create("chartdiv", am4charts.RadarChart);
chart.scrollbarX = new am4core.Scrollbar();

var data = [];

for(var i = 0; i < 20; i++){
  data.push({category: i, value:Math.round(Math.random() * 100)});
}

chart.data = data;
chart.radius = am4core.percent(100);
chart.innerRadius = am4core.percent(50);

// Create axes
var categoryAxis = chart.xAxes.push(new am4charts.CategoryAxis());
categoryAxis.dataFields.category = "category";
categoryAxis.renderer.grid.template.location = 0;
categoryAxis.renderer.minGridDistance = 30;
categoryAxis.tooltip.disabled = true;
categoryAxis.renderer.minHeight = 110;
categoryAxis.renderer.grid.template.disabled = true;
//categoryAxis.renderer.labels.template.disabled = true;
let labelTemplate = categoryAxis.renderer.labels.template;
labelTemplate.radius = am4core.percent(-60);
labelTemplate.location = 0.5;
labelTemplate.relativeRotation = 90;

var valueAxis = chart.yAxes.push(new am4charts.ValueAxis());
valueAxis.renderer.grid.template.disabled = true;
valueAxis.renderer.labels.template.disabled = true;
valueAxis.tooltip.disabled = true;

// Create series
var series = chart.series.push(new am4charts.RadarColumnSeries());
series.sequencedInterpolation = true;
series.dataFields.valueY = "value";
series.dataFields.categoryX = "category";
series.columns.template.strokeWidth = 0;
series.tooltipText = "{valueY}";
series.columns.template.radarColumn.cornerRadius = 10;
series.columns.template.radarColumn.innerCornerRadius = 0;

series.tooltip.pointerOrientation = "vertical";

// on hover, make corner radiuses bigger
let hoverState = series.columns.template.radarColumn.states.create("hover");
hoverState.properties.cornerRadius = 0;
hoverState.properties.fillOpacity = 1;


series.columns.template.adapter.add("fill", function(fill, target) {
  return chart.colors.getIndex(target.dataItem.index);
})

// Cursor
chart.cursor = new am4charts.RadarCursor();
chart.cursor.innerRadius = am4core.percent(50);
chart.cursor.lineY.disabled = true;

}); // end am4core.ready()
</script>

<!-- HTML -->
<div id="chartdiv"></div> 