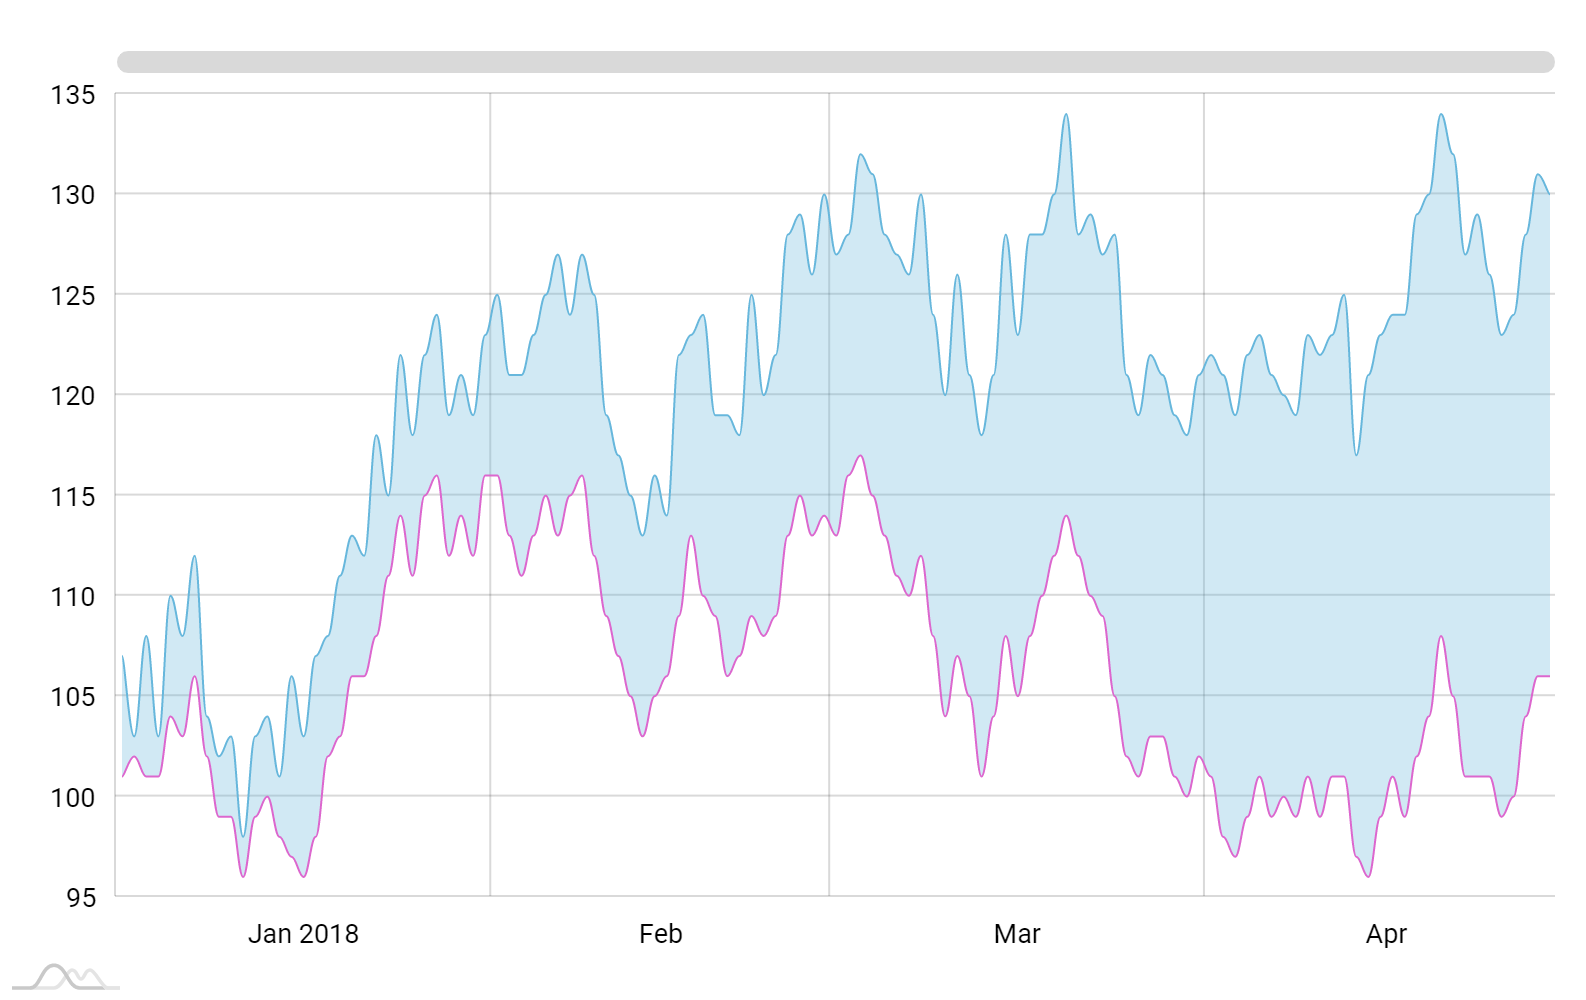
Range area chart
Range Area Chart is a type of area chart where rather than starting on the axis, the area is represented by the space between two values. These charts are useful for displaying ranges of values, such as between minimum and maximum prices over a timespan, or projected values for the future when the projection is represented by a range instead of a specific value.
Demo source
<!-- Styles -->
<style>
#chartdiv {
  width: 100%;
  height: 500px;
}

</style>

<!-- Resources -->
<script src="https://cdn.amcharts.com/lib/4/core.js"></script>
<script src="https://cdn.amcharts.com/lib/4/charts.js"></script>
<script src="https://cdn.amcharts.com/lib/4/themes/animated.js"></script>

<!-- Chart code -->
<script>
am4core.ready(function() {

// Themes begin
am4core.useTheme(am4themes_animated);
// Themes end

var chart = am4core.create("chartdiv", am4charts.XYChart);
chart.hiddenState.properties.opacity = 0; // this creates initial fade-in

var data = [];
var open = 100;
var close = 250;

for (var i = 1; i < 120; i++) {
  open += Math.round((Math.random() < 0.5 ? 1 : -1) * Math.random() * 4);
  close = Math.round(open + Math.random() * 5 + i / 5 - (Math.random() < 0.5 ? 1 : -1) * Math.random() * 2);
  data.push({ date: new Date(2018, 0, i), open: open, close: close });
}

chart.data = data;

var dateAxis = chart.xAxes.push(new am4charts.DateAxis());

var valueAxis = chart.yAxes.push(new am4charts.ValueAxis());
valueAxis.tooltip.disabled = true;

var series = chart.series.push(new am4charts.LineSeries());
series.dataFields.dateX = "date";
series.dataFields.openValueY = "open";
series.dataFields.valueY = "close";
series.tooltipText = "open: {openValueY.value} close: {valueY.value}";
series.sequencedInterpolation = true;
series.fillOpacity = 0.3;
series.defaultState.transitionDuration = 1000;
series.tensionX = 0.8;

var series2 = chart.series.push(new am4charts.LineSeries());
series2.dataFields.dateX = "date";
series2.dataFields.valueY = "open";
series2.sequencedInterpolation = true;
series2.defaultState.transitionDuration = 1500;
series2.stroke = chart.colors.getIndex(6);
series2.tensionX = 0.8;

chart.cursor = new am4charts.XYCursor();
chart.cursor.xAxis = dateAxis;
chart.scrollbarX = new am4core.Scrollbar();

}); // end am4core.ready()
</script>

<!-- HTML -->
<div id="chartdiv"></div>