JavaScript TypeScript / ES6 ...
<style >
#chartdiv {
width : 100% ;
height : 500px ;
}
</style >
<script src ="https://cdn.amcharts.com/lib/4/core.js" > </script >
<script src ="https://cdn.amcharts.com/lib/4/charts.js" > </script >
<script src ="https://cdn.amcharts.com/lib/4/themes/animated.js" > </script >
<script >
am4core.ready (function (useTheme (am4themes_animated);
var chart = am4core.create ("chartdiv" , am4charts.XYChart );
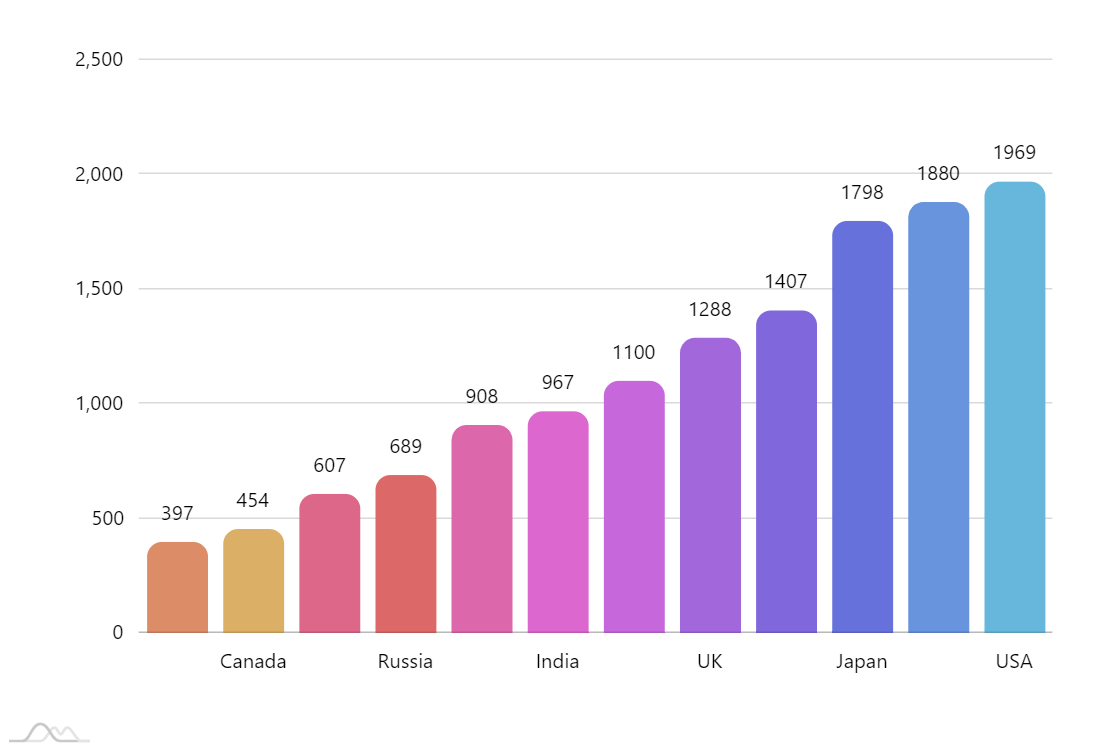
chart.data = [{
"country" : "USA" ,
"visits" : 2025
}, {
"country" : "China" ,
"visits" : 1882
}, {
"country" : "Japan" ,
"visits" : 1809
}, {
"country" : "Germany" ,
"visits" : 1322
}, {
"country" : "UK" ,
"visits" : 1122
}, {
"country" : "France" ,
"visits" : 1114
}, {
"country" : "India" ,
"visits" : 984
}, {
"country" : "Spain" ,
"visits" : 711
}, {
"country" : "Netherlands" ,
"visits" : 665
}, {
"country" : "Russia" ,
"visits" : 580
}, {
"country" : "South Korea" ,
"visits" : 443
}, {
"country" : "Canada" ,
"visits" : 441
}];
chart.padding (40 , 40 , 40 , 40 );
var categoryAxis = chart.xAxes .push (new am4charts.CategoryAxis ());
categoryAxis.renderer .grid .template .location = 0 ;
categoryAxis.dataFields .category = "country" ;
categoryAxis.renderer .minGridDistance = 60 ;
categoryAxis.renderer .inversed = true ;
categoryAxis.renderer .grid .template .disabled = true ;
var valueAxis = chart.yAxes .push (new am4charts.ValueAxis ());
valueAxis.min = 0 ;
valueAxis.extraMax = 0.1 ;
var series = chart.series .push (new am4charts.ColumnSeries ());
series.dataFields .categoryX = "country" ;
series.dataFields .valueY = "visits" ;
series.tooltipText = "{valueY.value}"
series.columns .template .strokeOpacity = 0 ;
series.columns .template .column .cornerRadiusTopRight = 10 ;
series.columns .template .column .cornerRadiusTopLeft = 10 ;
var labelBullet = series.bullets .push (new am4charts.LabelBullet ());
labelBullet.label .verticalCenter = "bottom" ;
labelBullet.label .dy = -10 ;
labelBullet.label .text = "{values.valueY.workingValue.formatNumber('#.')}" ;
chart.zoomOutButton .disabled = true ;
series.columns .template .adapter .add ("fill" , function (fill, target ) {
return chart.colors .getIndex (target.dataItem .index );
});
setInterval (function (array .each (chart.data , function (item ) {
item.visits += Math .round (Math .random () * 200 - 100 );
item.visits = Math .abs (item.visits );
})
chart.invalidateRawData ();
}, 2000 )
categoryAxis.sortBySeries = series;
});
</script >
<div id ="chartdiv" > </div >
import * as am4core from "@amcharts/amcharts4/core" ;
import * as am4charts from "@amcharts/amcharts4/charts" ;
import am4themes_animated from "@amcharts/amcharts4/themes/animated" ;
am4core.useTheme (am4themes_animated);
let chart = am4core.create ("chartdiv" , am4charts.XYChart );
chart.data = [{
"country" : "USA" ,
"visits" : 2025
}, {
"country" : "China" ,
"visits" : 1882
}, {
"country" : "Japan" ,
"visits" : 1809
}, {
"country" : "Germany" ,
"visits" : 1322
}, {
"country" : "UK" ,
"visits" : 1122
}, {
"country" : "France" ,
"visits" : 1114
}, {
"country" : "India" ,
"visits" : 984
}, {
"country" : "Spain" ,
"visits" : 711
}, {
"country" : "Netherlands" ,
"visits" : 665
}, {
"country" : "Russia" ,
"visits" : 580
}, {
"country" : "South Korea" ,
"visits" : 443
}, {
"country" : "Canada" ,
"visits" : 441
}];
chart.padding (40 , 40 , 40 , 40 );
let categoryAxis = chart.xAxes .push (new am4charts.CategoryAxis ());
categoryAxis.renderer .grid .template .location = 0 ;
categoryAxis.dataFields .category = "country" ;
categoryAxis.renderer .minGridDistance = 60 ;
categoryAxis.renderer .inversed = true ;
categoryAxis.renderer .grid .template .disabled = true ;
let valueAxis = chart.yAxes .push (new am4charts.ValueAxis ());
valueAxis.min = 0 ;
valueAxis.extraMax = 0.1 ;
let series = chart.series .push (new am4charts.ColumnSeries ());
series.dataFields .categoryX = "country" ;
series.dataFields .valueY = "visits" ;
series.tooltipText = "{valueY.value}"
series.columns .template .strokeOpacity = 0 ;
series.columns .template .column .cornerRadiusTopRight = 10 ;
series.columns .template .column .cornerRadiusTopLeft = 10 ;
let labelBullet = series.bullets .push (new am4charts.LabelBullet ());
labelBullet.label .verticalCenter = "bottom" ;
labelBullet.label .dy = -10 ;
labelBullet.label .text = "{values.valueY.workingValue.formatNumber('#.')}" ;
chart.zoomOutButton .disabled = true ;
series.columns .template .adapter .add ("fill" , function (fill, target ) {
return chart.colors .getIndex (target.dataItem .index );
});
setInterval (function (array .each (chart.data , function (item ) {
item.visits += Math .round (Math .random () * 200 - 100 );
item.visits = Math .abs (item.visits );
})
chart.invalidateRawData ();
}, 2000 )
categoryAxis.sortBySeries = series;