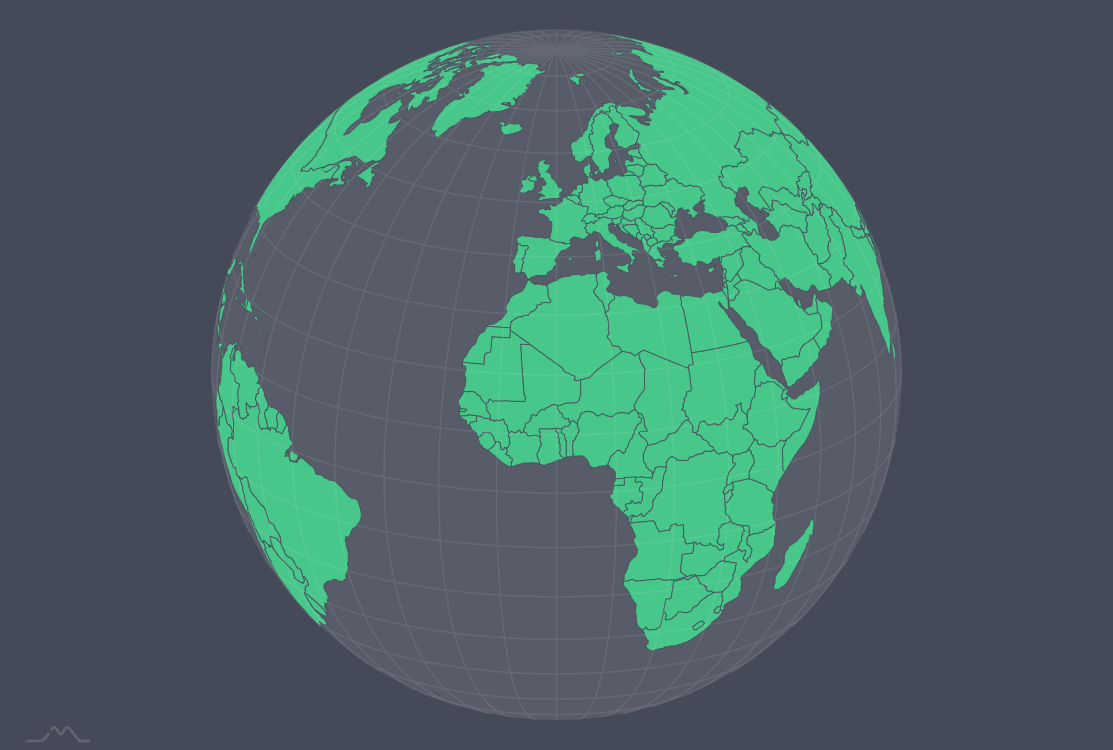
Rotating globe
Orthographic projection
Orthographic projection allows projection any map in a globe-like shape.
Go ahead and try to rotate the map!
More about using orthographic projection
Demo source
<!-- Styles -->
<style>
#chartdiv {
  width: 100%;
  height: 500px;
  max-width:100%;
  background-color:#454a58;
}

</style>

<!-- Resources -->
<script src="https://cdn.amcharts.com/lib/4/core.js"></script>
<script src="https://cdn.amcharts.com/lib/4/maps.js"></script>
<script src="https://cdn.amcharts.com/lib/4/geodata/worldLow.js"></script>
<script src="https://cdn.amcharts.com/lib/4/themes/animated.js"></script>

<!-- Chart code -->
<script>
am4core.ready(function() {

// Themes begin
am4core.useTheme(am4themes_animated);
// Themes end

var chart = am4core.create("chartdiv", am4maps.MapChart);

// Set map definition
chart.geodata = am4geodata_worldLow;

// Set projection
chart.projection = new am4maps.projections.Orthographic();
chart.panBehavior = "rotateLongLat";
chart.deltaLatitude = -20;
chart.padding(20,20,20,20);

// limits vertical rotation
chart.adapter.add("deltaLatitude", function(delatLatitude){
    return am4core.math.fitToRange(delatLatitude, -90, 90);
})

// Create map polygon series
var polygonSeries = chart.series.push(new am4maps.MapPolygonSeries());

// Make map load polygon (like country names) data from GeoJSON
polygonSeries.useGeodata = true;

// Configure series
var polygonTemplate = polygonSeries.mapPolygons.template;
polygonTemplate.tooltipText = "{name}";
polygonTemplate.fill = am4core.color("#47c78a");
polygonTemplate.stroke = am4core.color("#454a58");
polygonTemplate.strokeWidth = 0.5;

var graticuleSeries = chart.series.push(new am4maps.GraticuleSeries());
graticuleSeries.mapLines.template.line.stroke = am4core.color("#ffffff");
graticuleSeries.mapLines.template.line.strokeOpacity = 0.08;
graticuleSeries.fitExtent = false;


chart.backgroundSeries.mapPolygons.template.polygon.fillOpacity = 0.1;
chart.backgroundSeries.mapPolygons.template.polygon.fill = am4core.color("#ffffff");

// Create hover state and set alternative fill color
var hs = polygonTemplate.states.create("hover");
hs.properties.fill = chart.colors.getIndex(0).brighten(-0.5);

let animation;
setTimeout(function(){
  animation = chart.animate({property:"deltaLongitude", to:100000}, 20000000);
}, 3000)

chart.seriesContainer.events.on("down", function(){
if(animation){
  animation.stop();
}
})

}); // end am4core.ready()
</script>

<!-- HTML -->
<div id="chartdiv"></div>