Rotating globe with circles
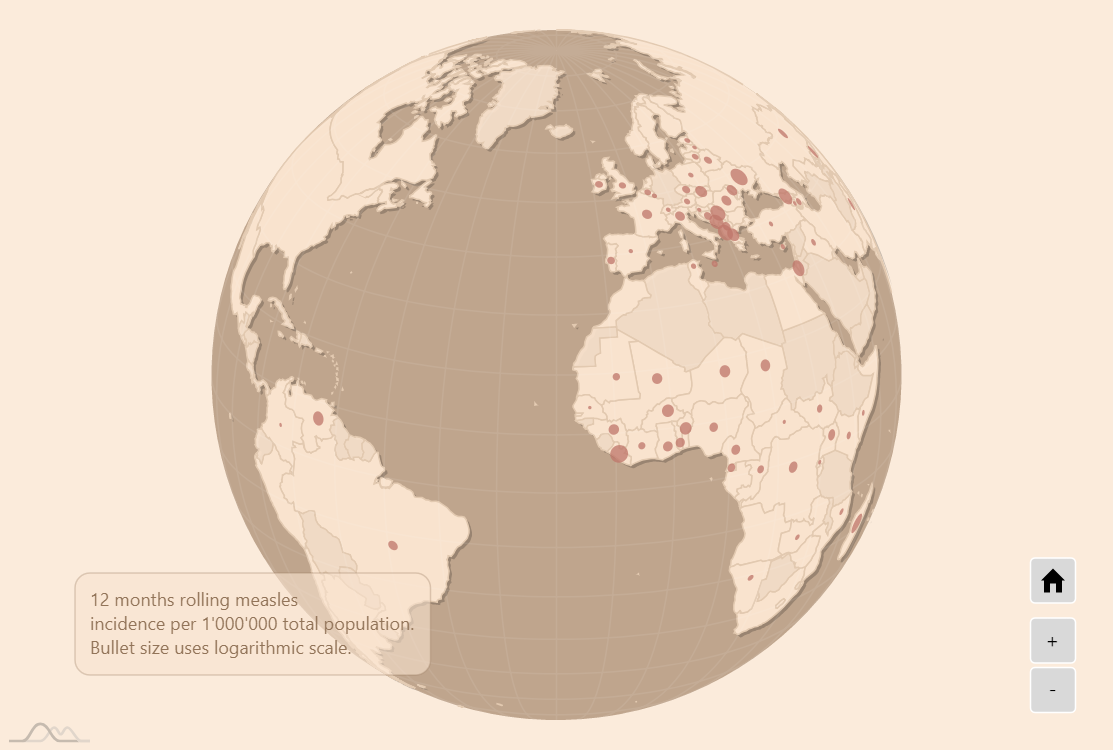
With amCharts 4 you can create amazing Map charts and you don’t have to be limited to flattened representation of Earth. As you can see in this demo, you can use an orthographic projection to display the planet as an interactive globe.
Learn more about map projections in our documentation.
Demo source
<!-- Styles -->
<style>
#chartdiv {
  max-width: 100%;
  height: 600px;
  background-color:#fbebdb;
}
</style>

<!-- Resources -->
<script src="https://cdn.amcharts.com/lib/4/core.js"></script>
<script src="https://cdn.amcharts.com/lib/4/maps.js"></script>
<script src="https://cdn.amcharts.com/lib/4/geodata/continentsLow.js"></script>
<script src="https://cdn.amcharts.com/lib/4/geodata/worldLow.js"></script>
<script src="https://cdn.amcharts.com/lib/4/themes/animated.js"></script>

<!-- Chart code -->
<script>
am4core.ready(function() {

// Themes begin
am4core.useTheme(am4themes_animated);
// Themes end

// Create map instance
var chart = am4core.create("chartdiv", am4maps.MapChart);
var interfaceColors = new am4core.InterfaceColorSet();

try {
    chart.geodata = am4geodata_worldLow;
}
catch (e) {
    chart.raiseCriticalError(new Error("Map geodata could not be loaded. Please download the latest <a href=\"https://www.amcharts.com/download/download-v4/\">amcharts geodata</a> and extract its contents into the same directory as your amCharts files."));
}


var label = chart.createChild(am4core.Label)
label.text = "12 months (3/7/2019 data) rolling measles\nincidence per 1'000'000 total population. \n Bullet size uses logarithmic scale.";
label.fontSize = 12;
label.align = "left";
label.valign = "bottom"
label.fill = am4core.color("#927459");
label.background = new am4core.RoundedRectangle()
label.background.cornerRadius(10,10,10,10);
label.padding(10,10,10,10);
label.marginLeft = 30;
label.marginBottom = 30;
label.background.strokeOpacity = 0.3;
label.background.stroke =am4core.color("#927459");
label.background.fill = am4core.color("#f9e3ce");
label.background.fillOpacity = 0.6;

var dataSource = chart.createChild(am4core.TextLink)
dataSource.text = "Data source: WHO";
dataSource.fontSize = 12;
dataSource.align = "left";
dataSource.valign = "top"
dataSource.url = "https://www.who.int/immunization/monitoring_surveillance/burden/vpd/surveillance_type/active/measles_monthlydata/en/"
dataSource.urlTarget = "_blank";
dataSource.fill = am4core.color("#927459");
dataSource.padding(10,10,10,10);
dataSource.marginLeft = 30;
dataSource.marginTop = 30;

// Set projection
chart.projection = new am4maps.projections.Orthographic();
chart.panBehavior = "rotateLongLat";
chart.padding(20,20,20,20);

// Add zoom control
chart.zoomControl = new am4maps.ZoomControl();

var homeButton = new am4core.Button();
homeButton.events.on("hit", function(){
  chart.goHome();
});

homeButton.icon = new am4core.Sprite();
homeButton.padding(7, 5, 7, 5);
homeButton.width = 30;
homeButton.icon.path = "M16,8 L14,8 L14,16 L10,16 L10,10 L6,10 L6,16 L2,16 L2,8 L0,8 L8,0 L16,8 Z M16,8";
homeButton.marginBottom = 10;
homeButton.parent = chart.zoomControl;
homeButton.insertBefore(chart.zoomControl.plusButton);

chart.backgroundSeries.mapPolygons.template.polygon.fill = am4core.color("#bfa58d");
chart.backgroundSeries.mapPolygons.template.polygon.fillOpacity = 1;
chart.deltaLongitude = 20;
chart.deltaLatitude = -20;

// limits vertical rotation
chart.adapter.add("deltaLatitude", function(delatLatitude){
    return am4core.math.fitToRange(delatLatitude, -90, 90);
})

// Create map polygon series

var shadowPolygonSeries = chart.series.push(new am4maps.MapPolygonSeries());
shadowPolygonSeries.geodata = am4geodata_continentsLow;

try {
    shadowPolygonSeries.geodata = am4geodata_continentsLow;
}
catch (e) {
    shadowPolygonSeries.raiseCriticalError(new Error("Map geodata could not be loaded. Please download the latest <a href=\"https://www.amcharts.com/download/download-v4/\">amcharts geodata</a> and extract its contents into the same directory as your amCharts files."));
}

shadowPolygonSeries.useGeodata = true;
shadowPolygonSeries.dx = 2;
shadowPolygonSeries.dy = 2;
shadowPolygonSeries.mapPolygons.template.fill = am4core.color("#000");
shadowPolygonSeries.mapPolygons.template.fillOpacity = 0.2;
shadowPolygonSeries.mapPolygons.template.strokeOpacity = 0;
shadowPolygonSeries.fillOpacity = 0.1;
shadowPolygonSeries.fill = am4core.color("#000");


// Create map polygon series
var polygonSeries = chart.series.push(new am4maps.MapPolygonSeries());
polygonSeries.useGeodata = true;

polygonSeries.calculateVisualCenter = true;
polygonSeries.tooltip.background.fillOpacity = 0.2;
polygonSeries.tooltip.background.cornerRadius = 20;

var template = polygonSeries.mapPolygons.template;
template.nonScalingStroke = true;
template.fill = am4core.color("#f9e3ce");
template.stroke = am4core.color("#e2c9b0");

polygonSeries.calculateVisualCenter = true;
template.propertyFields.id = "id";
template.tooltipPosition = "fixed";
template.fillOpacity = 1;

template.events.on("over", function (event) {
  if (event.target.dummyData) {
    event.target.dummyData.isHover = true;
  }
})
template.events.on("out", function (event) {
  if (event.target.dummyData) {
    event.target.dummyData.isHover = false;
  }
})

var hs = polygonSeries.mapPolygons.template.states.create("hover");
hs.properties.fillOpacity = 1;
hs.properties.fill = am4core.color("#deb7ad");


var graticuleSeries = chart.series.push(new am4maps.GraticuleSeries());
graticuleSeries.mapLines.template.stroke = am4core.color("#fff");
graticuleSeries.fitExtent = false;
graticuleSeries.mapLines.template.strokeOpacity = 0.2;
graticuleSeries.mapLines.template.stroke = am4core.color("#fff");


var measelsSeries = chart.series.push(new am4maps.MapPolygonSeries())
measelsSeries.tooltip.background.fillOpacity = 0;
measelsSeries.tooltip.background.cornerRadius = 20;
measelsSeries.tooltip.autoTextColor = false;
measelsSeries.tooltip.label.fill = am4core.color("#000");
measelsSeries.tooltip.dy = -5;

var measelTemplate = measelsSeries.mapPolygons.template;
measelTemplate.fill = am4core.color("#bf7569");
measelTemplate.strokeOpacity = 0;
measelTemplate.fillOpacity = 0.75;
measelTemplate.tooltipPosition = "fixed";


var hs2 = measelsSeries.mapPolygons.template.states.create("hover");
hs2.properties.fillOpacity = 1;
hs2.properties.fill = am4core.color("#86240c");

polygonSeries.events.on("inited", function () {
  polygonSeries.mapPolygons.each(function (mapPolygon) {
    var count = data[mapPolygon.id];

    if (count > 0) {
      var polygon = measelsSeries.mapPolygons.create();
      polygon.multiPolygon = am4maps.getCircle(mapPolygon.visualLongitude, mapPolygon.visualLatitude, Math.max(0.2, Math.log(count) * Math.LN10 / 10));
      polygon.tooltipText = mapPolygon.dataItem.dataContext.name + ": " + count;
      mapPolygon.dummyData = polygon;
      polygon.events.on("over", function () {
        mapPolygon.isHover = true;
      })
      polygon.events.on("out", function () {
        mapPolygon.isHover = false;
      })
    }
    else {
      mapPolygon.tooltipText = mapPolygon.dataItem.dataContext.name + ": no data";
      mapPolygon.fillOpacity = 0.9;
    }

  })
})


var data = {
  "AL": 504.38,
  "AM": 6.5,
  "AO": 2.98,
  "AR": 0.32,
  "AT": 10.9,
  "AU": 5.02,
  "AZ": 17.38,
  "BA": 24.45,
  "BD": 13.4,
  "BE": 12.06,
  "BF": 93.37,
  "BG": 1.68,
  "BI": 0.95,
  "BJ": 93.36,
  "BR": 49.42,
  "BT": 10.03,
  "BY": 26.16,
  "CA": 0.96,
  "CD": 69.71,
  "CF": 4.57,
  "CG": 19.7,
  "CH": 6.19,
  "CI": 14.1,
  "CL": 1.4,
  "CM": 41.26,
  "CN": 2.6,
  "CO": 4.48,
  "CY": 7.69,
  "CZ": 23.09,
  "DK": 1.58,
  "EE": 9.91,
  "EG": 0.63,
  "ES": 4.96,
  "FI": 3.27,
  "FR": 43.26,
  "GA": 3.03,
  "GB": 14.3,
  "GE": 809.09,
  "GH": 39.78,
  "GM": 2.45,
  "GN": 45.98,
  "GQ": 23.74,
  "GR": 154.42,
  "HR": 5.46,
  "HU": 1.44,
  "ID": 16.87,
  "IE": 17.56,
  "IL": 412.24,
  "IN": 47.85,
  "IQ": 12.96,
  "IR": 1.13,
  "IT": 44.29,
  "JP": 3.27,
  "KE": 16.8,
  "KG": 253.37,
  "KH": 0.44,
  "KM": 1.26,
  "KZ": 116.3,
  "LA": 1.33,
  "LK": 0.53,
  "LR": 692.27,
  "LS": 5.9,
  "LT": 14.44,
  "LU": 6.95,
  "LV": 6.09,
  "MA": 0.2,
  "MD": 83.75,
  "ME": 319.75,
  "MG": 2386.35,
  "MK": 28.83,
  "ML": 48.68,
  "MM": 40.31,
  "MN": 0.66,
  "MR": 14.65,
  "MT": 11.65,
  "MV": 9.35,
  "MX": 0.04,
  "MY": 86.41,
  "MZ": 13.49,
  "NA": 12.9,
  "NE": 80.88,
  "NG": 31.44,
  "NL": 1.47,
  "NO": 2.47,
  "NP": 10.8,
  "NZ": 9.23,
  "PE": 1.29,
  "PK": 159.14,
  "PL": 8.24,
  "PT": 16.68,
  "RO": 63.05,
  "RS": 473.46,
  "RU": 14.24,
  "RW": 5.45,
  "SE": 2.64,
  "SG": 8.18,
  "SI": 3.37,
  "SK": 112.78,
  "SN": 3.37,
  "SO": 8.03,
  "SS": 19.3,
  "TD": 75.63,
  "TG": 34.84,
  "TH": 81.02,
  "TL": 9.46,
  "TN": 7.8,
  "TR": 7.08,
  "UA": 1439.02,
  "UG": 62.55,
  "US": 1.32,
  "UZ": 0.99,
  "VE": 179.55,
  "ZA": 3.09,
  "ZM": 9.82,
  "ZW": 0.06
}

}); // end am4core.ready()
</script>

<!-- HTML -->
<div id="chartdiv"></div>