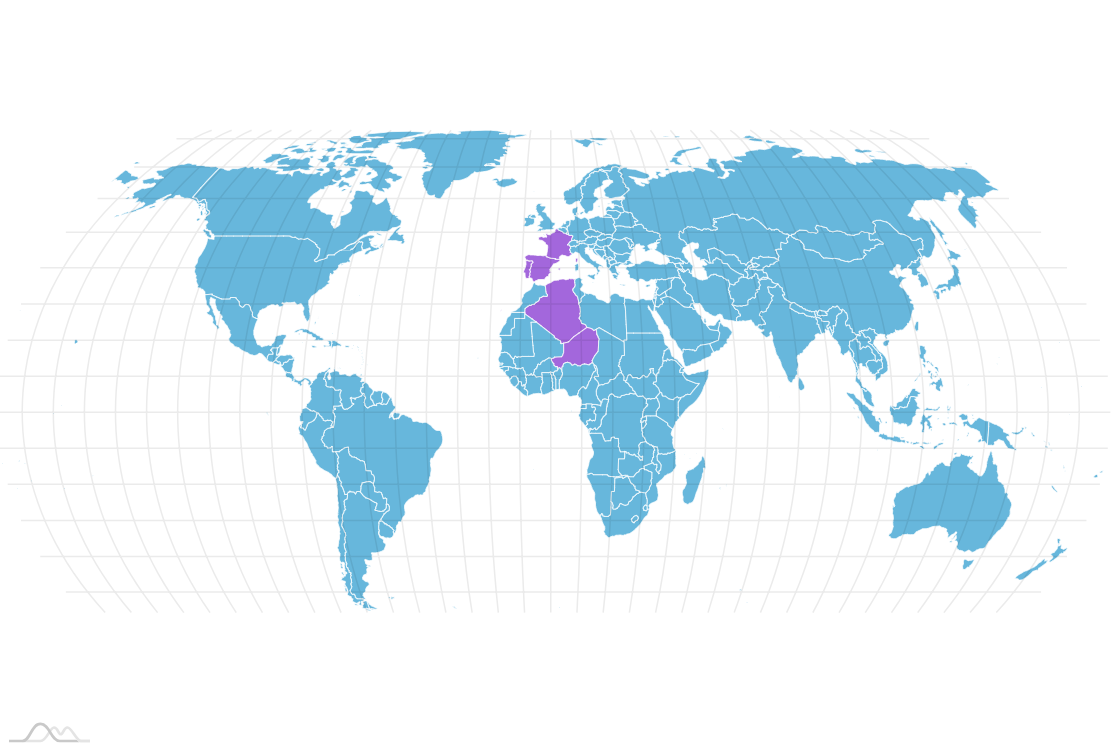
Selecting multiple areas map
Using “active” state
It’s easy to toggle between element’s “active” state. Just set its isActive property to either true or false.
The map will automatically apply “active” state, which can have any property overrides, like, in this instance, color.
Demo source
<!-- Styles -->
<style>
#chartdiv {
  width: 100%;
  height: 500px;
}

</style>

<!-- Resources -->
<script src="https://cdn.amcharts.com/lib/4/core.js"></script>
<script src="https://cdn.amcharts.com/lib/4/maps.js"></script>
<script src="https://cdn.amcharts.com/lib/4/geodata/worldLow.js"></script>
<script src="https://cdn.amcharts.com/lib/4/themes/animated.js"></script>

<!-- Chart code -->
<script>
am4core.ready(function() {

// Themes begin
am4core.useTheme(am4themes_animated);
// Themes end

// Create map instance
var chart = am4core.create("chartdiv", am4maps.MapChart);

// Set map definition
chart.geodata = am4geodata_worldLow;

// Set projection
chart.projection = new am4maps.projections.NaturalEarth1();

// Create map polygon series
var polygonSeries = chart.series.push(new am4maps.MapPolygonSeries());
polygonSeries.mapPolygons.template.strokeWidth = 0.5;

// Exclude Antartica
polygonSeries.exclude = ["AQ"];

// Make map load polygon (like country names) data from GeoJSON
polygonSeries.useGeodata = true;

// Configure series
var polygonTemplate = polygonSeries.mapPolygons.template;
polygonTemplate.tooltipText = "{name}";
polygonTemplate.fill = chart.colors.getIndex(0);

// Create hover state and set alternative fill color
var hs = polygonTemplate.states.create("hover");
hs.properties.fill = chart.colors.getIndex(2);

// Create active state
var activeState = polygonTemplate.states.create("active");
activeState.properties.fill = chart.colors.getIndex(4);

// Create an event to toggle "active" state
polygonTemplate.events.on("hit", function(ev) {
  ev.target.isActive = !ev.target.isActive;
})


var graticuleSeries = chart.series.push(new am4maps.GraticuleSeries());

}); // end am4core.ready()
</script>

<!-- HTML -->
<div id="chartdiv"></div>