Smoothed Line Chart
Customizable line tension
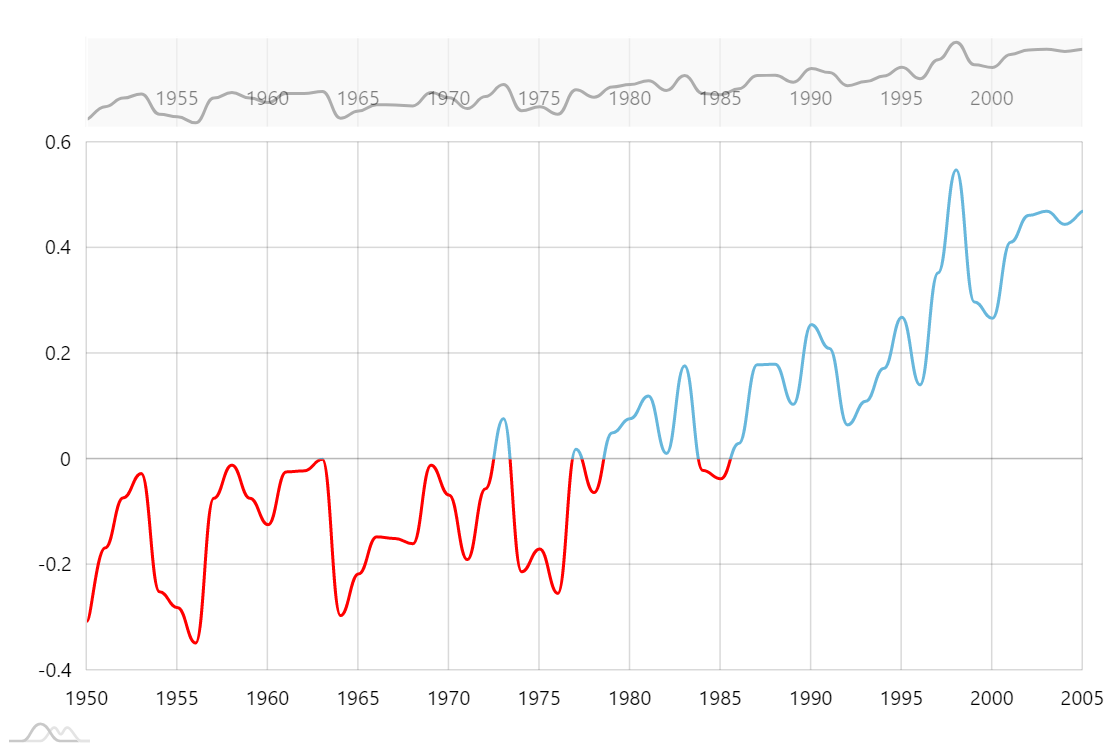
Line series has two very easy settings that can control how line smoothing algorithm works: tensionX and tensionY.
This allows tailoring smoothed line to suit your needs and data.
Axis ranges
Axis ranges is another powerful feature of amCharts 4. Besides other uses, it allows defining a range on any axis. Any visual property of the series, that falls within this specific range, will be overridden with specific values.
Demo source
<!-- Styles -->
<style>
#chartdiv {
  width: 100%;
  height: 500px;
}

</style>

<!-- Resources -->
<script src="https://cdn.amcharts.com/lib/4/core.js"></script>
<script src="https://cdn.amcharts.com/lib/4/charts.js"></script>
<script src="https://cdn.amcharts.com/lib/4/themes/animated.js"></script>

<!-- Chart code -->
<script>
am4core.ready(function() {

// Themes begin
am4core.useTheme(am4themes_animated);
// Themes end

// Create chart instance
var chart = am4core.create("chartdiv", am4charts.XYChart);
chart.paddingRight = 20;

// Add data
chart.data = [{
  "year": "1950",
  "value": -0.307
}, {
  "year": "1951",
  "value": -0.168
}, {
  "year": "1952",
  "value": -0.073
}, {
  "year": "1953",
  "value": -0.027
}, {
  "year": "1954",
  "value": -0.251
}, {
  "year": "1955",
  "value": -0.281
}, {
  "year": "1956",
  "value": -0.348
}, {
  "year": "1957",
  "value": -0.074
}, {
  "year": "1958",
  "value": -0.011
}, {
  "year": "1959",
  "value": -0.074
}, {
  "year": "1960",
  "value": -0.124
}, {
  "year": "1961",
  "value": -0.024
}, {
  "year": "1962",
  "value": -0.022
}, {
  "year": "1963",
  "value": 0
}, {
  "year": "1964",
  "value": -0.296
}, {
  "year": "1965",
  "value": -0.217
}, {
  "year": "1966",
  "value": -0.147
}, {
  "year": "1967",
  "value": -0.15
}, {
  "year": "1968",
  "value": -0.16
}, {
  "year": "1969",
  "value": -0.011
}, {
  "year": "1970",
  "value": -0.068
}, {
  "year": "1971",
  "value": -0.19
}, {
  "year": "1972",
  "value": -0.056
}, {
  "year": "1973",
  "value": 0.077
}, {
  "year": "1974",
  "value": -0.213
}, {
  "year": "1975",
  "value": -0.17
}, {
  "year": "1976",
  "value": -0.254
}, {
  "year": "1977",
  "value": 0.019
}, {
  "year": "1978",
  "value": -0.063
}, {
  "year": "1979",
  "value": 0.05
}, {
  "year": "1980",
  "value": 0.077
}, {
  "year": "1981",
  "value": 0.12
}, {
  "year": "1982",
  "value": 0.011
}, {
  "year": "1983",
  "value": 0.177
}, {
  "year": "1984",
  "value": -0.021
}, {
  "year": "1985",
  "value": -0.037
}, {
  "year": "1986",
  "value": 0.03
}, {
  "year": "1987",
  "value": 0.179
}, {
  "year": "1988",
  "value": 0.18
}, {
  "year": "1989",
  "value": 0.104
}, {
  "year": "1990",
  "value": 0.255
}, {
  "year": "1991",
  "value": 0.21
}, {
  "year": "1992",
  "value": 0.065
}, {
  "year": "1993",
  "value": 0.11
}, {
  "year": "1994",
  "value": 0.172
}, {
  "year": "1995",
  "value": 0.269
}, {
  "year": "1996",
  "value": 0.141
}, {
  "year": "1997",
  "value": 0.353
}, {
  "year": "1998",
  "value": 0.548
}, {
  "year": "1999",
  "value": 0.298
}, {
  "year": "2000",
  "value": 0.267
}, {
  "year": "2001",
  "value": 0.411
}, {
  "year": "2002",
  "value": 0.462
}, {
  "year": "2003",
  "value": 0.47
}, {
  "year": "2004",
  "value": 0.445
}, {
  "year": "2005",
  "value": 0.47
}];

// Create axes
var categoryAxis = chart.xAxes.push(new am4charts.CategoryAxis());
categoryAxis.dataFields.category = "year";
categoryAxis.renderer.minGridDistance = 50;
categoryAxis.renderer.grid.template.location = 0.5;
categoryAxis.startLocation = 0.5;
categoryAxis.endLocation = 0.5;

// Create value axis
var valueAxis = chart.yAxes.push(new am4charts.ValueAxis());
valueAxis.baseValue = 0;

// Create series
var series = chart.series.push(new am4charts.LineSeries());
series.dataFields.valueY = "value";
series.dataFields.categoryX = "year";
series.strokeWidth = 2;
series.tensionX = 0.77;

// bullet is added because we add tooltip to a bullet for it to change color
var bullet = series.bullets.push(new am4charts.Bullet());
bullet.tooltipText = "{valueY}";

bullet.adapter.add("fill", function(fill, target){
    if(target.dataItem.valueY < 0){
        return am4core.color("#FF0000");
    }
    return fill;
})
var range = valueAxis.createSeriesRange(series);
range.value = 0;
range.endValue = -1000;
range.contents.stroke = am4core.color("#FF0000");
range.contents.fill = range.contents.stroke;

// Add scrollbar
var scrollbarX = new am4charts.XYChartScrollbar();
scrollbarX.series.push(series);
chart.scrollbarX = scrollbarX;

chart.cursor = new am4charts.XYCursor();

}); // end am4core.ready()
</script>

<!-- HTML -->
<div id="chartdiv"></div>