Solid Gauge
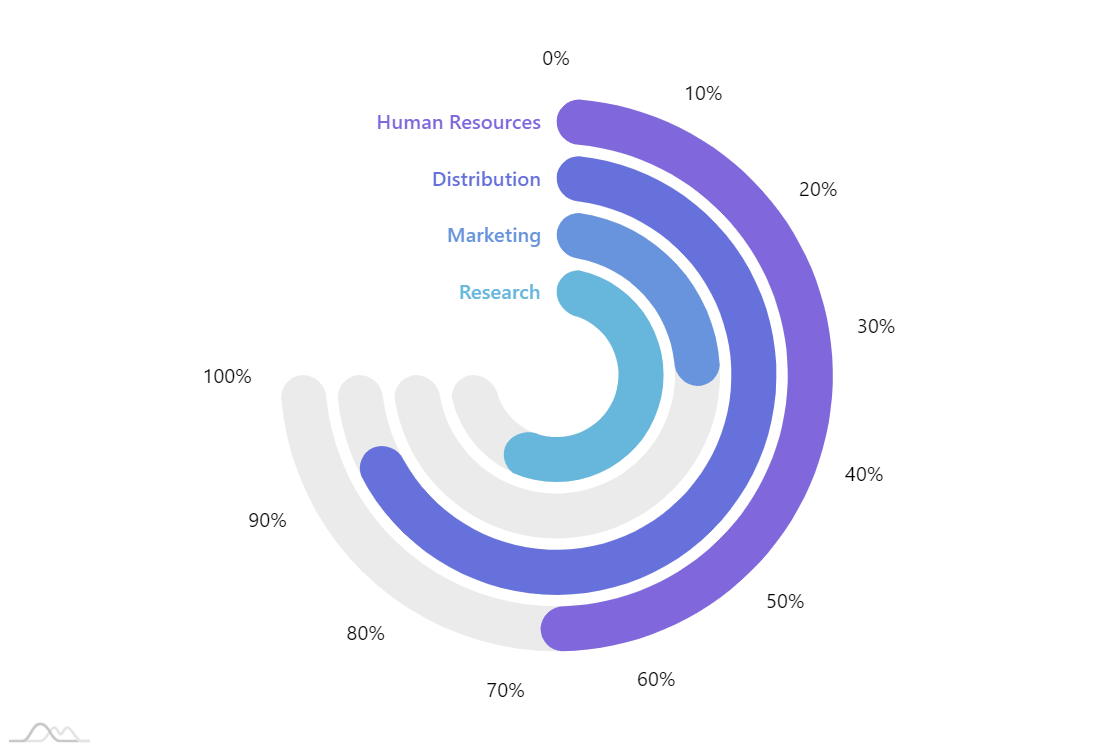
Solid Gauge Chart is similar to the Angular Gauge Chart and is most commonly used to mimic real-world gauges. The main difference from the Angular Gauge Chart is that the values are displayed by a filled portion of a gauge scale rather than a hand of a mechanical-like gauge.
Demo source
<!-- Styles -->
<style>
#chartdiv {
  width: 100%;
  height: 500px;
}

</style>

<!-- Resources -->
<script src="https://cdn.amcharts.com/lib/4/core.js"></script>
<script src="https://cdn.amcharts.com/lib/4/charts.js"></script>
<script src="https://cdn.amcharts.com/lib/4/themes/animated.js"></script>

<!-- Chart code -->
<script>
am4core.ready(function() {

// Themes begin
am4core.useTheme(am4themes_animated);
// Themes end


// Create chart instance
var chart = am4core.create("chartdiv", am4charts.RadarChart);

// Add data
chart.data = [{
  "category": "Research",
  "value": 80,
  "full": 100
}, {
  "category": "Marketing",
  "value": 35,
  "full": 100
}, {
  "category": "Distribution",
  "value": 92,
  "full": 100
}, {
  "category": "Human Resources",
  "value": 68,
  "full": 100
}];

// Make chart not full circle
chart.startAngle = -90;
chart.endAngle = 180;
chart.innerRadius = am4core.percent(20);

// Set number format
chart.numberFormatter.numberFormat = "#.#'%'";

// Create axes
var categoryAxis = chart.yAxes.push(new am4charts.CategoryAxis());
categoryAxis.dataFields.category = "category";
categoryAxis.renderer.grid.template.location = 0;
categoryAxis.renderer.grid.template.strokeOpacity = 0;
categoryAxis.renderer.labels.template.horizontalCenter = "right";
categoryAxis.renderer.labels.template.fontWeight = 500;
categoryAxis.renderer.labels.template.adapter.add("fill", function(fill, target) {
  return (target.dataItem.index >= 0) ? chart.colors.getIndex(target.dataItem.index) : fill;
});
categoryAxis.renderer.minGridDistance = 10;

var valueAxis = chart.xAxes.push(new am4charts.ValueAxis());
valueAxis.renderer.grid.template.strokeOpacity = 0;
valueAxis.min = 0;
valueAxis.max = 100;
valueAxis.strictMinMax = true;

// Create series
var series1 = chart.series.push(new am4charts.RadarColumnSeries());
series1.dataFields.valueX = "full";
series1.dataFields.categoryY = "category";
series1.clustered = false;
series1.columns.template.fill = new am4core.InterfaceColorSet().getFor("alternativeBackground");
series1.columns.template.fillOpacity = 0.08;
series1.columns.template.cornerRadiusTopLeft = 20;
series1.columns.template.strokeWidth = 0;
series1.columns.template.radarColumn.cornerRadius = 20;

var series2 = chart.series.push(new am4charts.RadarColumnSeries());
series2.dataFields.valueX = "value";
series2.dataFields.categoryY = "category";
series2.clustered = false;
series2.columns.template.strokeWidth = 0;
series2.columns.template.tooltipText = "{category}: [bold]{value}[/]";
series2.columns.template.radarColumn.cornerRadius = 20;

series2.columns.template.adapter.add("fill", function(fill, target) {
  return chart.colors.getIndex(target.dataItem.index);
});

// Add cursor
chart.cursor = new am4charts.RadarCursor();

}); // end am4core.ready()
</script>

<!-- HTML -->
<div id="chartdiv"></div>