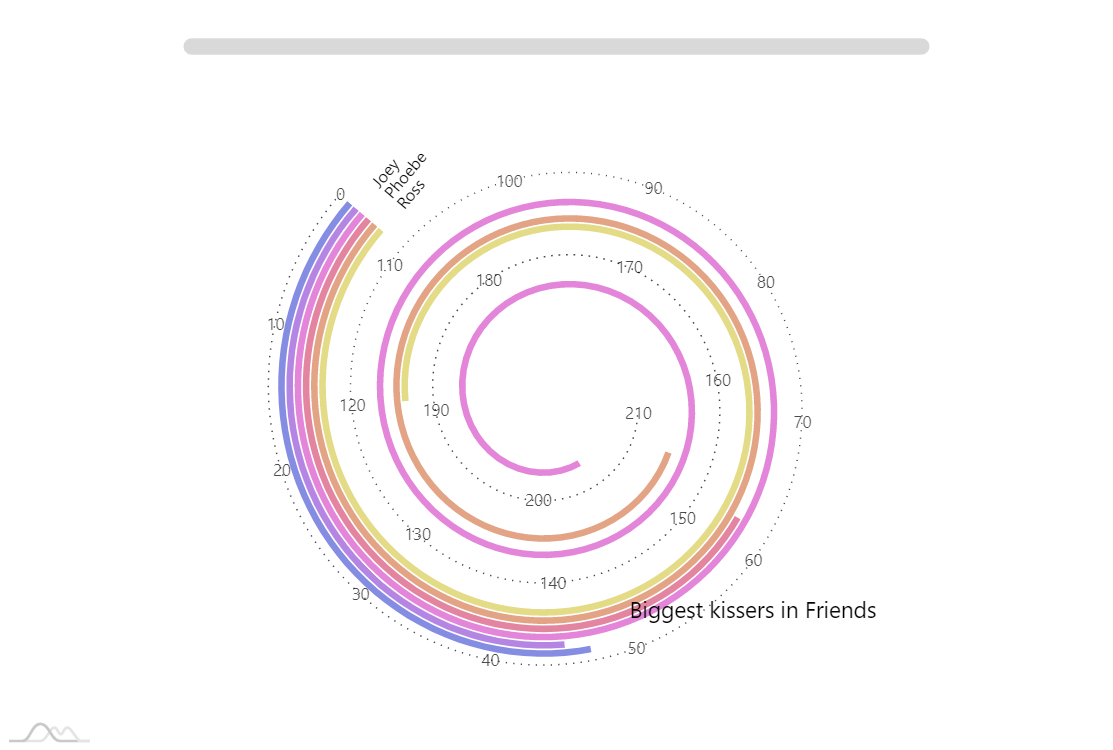
Spiral Bar chart
A spiral bar chart shows how many times in total main Friends series character kissed during 10 seasons of the show. This demo uses amCharts 4 TimeLine add-on.
Demo source
<!-- Styles -->
<style>
#chartdiv {
  width: 100%;
  height: 800px;
}

.demo-theme-dark .demo-background {
  background: #000;
}

</style>

<!-- Resources -->
<script src="https://cdn.amcharts.com/lib/4/core.js"></script>
<script src="https://cdn.amcharts.com/lib/4/charts.js"></script>
<script src="https://cdn.amcharts.com/lib/4/plugins/timeline.js"></script>
<script src="https://cdn.amcharts.com/lib/4/themes/animated.js"></script>

<!-- Chart code -->
<script>
am4core.ready(function() {

// Themes begin
am4core.useTheme(am4themes_animated);
// Themes end

var chart = am4core.create("chartdiv", am4plugins_timeline.SpiralChart);
chart.levelCount = 3;
chart.inversed = true;
chart.endAngle = -135;
chart.yAxisInnerRadius = 0;
chart.yAxisRadius = am4core.percent(70);
chart.padding(0,0,0,0)

chart.data = [
  { category: "" },
  { category: "Chandler", value: 47 },
  { category: "Joey", value: 45 },
  { category: "Monica", value: 204 },
  { category: "Phoebe", value: 62 },
  { category: "Rachel", value: 154 },
  { category: "Ross", value: 120 }];

chart.fontSize = 11;

var categoryAxis = chart.yAxes.push(new am4charts.CategoryAxis());
categoryAxis.dataFields.category = "category";
categoryAxis.renderer.grid.template.disabled = true;
categoryAxis.renderer.minGridDistance = 6;
categoryAxis.cursorTooltipEnabled = false;


var categoryAxisLabelTemplate = categoryAxis.renderer.labels.template;
categoryAxisLabelTemplate.paddingLeft = 20;
categoryAxisLabelTemplate.horizontalCenter = "left";
categoryAxisLabelTemplate.adapter.add("rotation", function (rotation, target) {
  var position = valueAxis.valueToPosition(valueAxis.min);
  return valueAxis.renderer.positionToAngle(position) + 90;
})


var valueAxis = chart.xAxes.push(new am4charts.ValueAxis());
valueAxis.renderer.minGridDistance = 70;

valueAxis.renderer.line.strokeDasharray = "1,4";
valueAxis.renderer.line.strokeOpacity = 0.7;
valueAxis.renderer.grid.template.disabled = true;
valueAxis.zIndex = 100;
valueAxis.cursorTooltipEnabled = false;
valueAxis.min = 0;

var labelTemplate = valueAxis.renderer.labels.template;
labelTemplate.verticalCenter = "middle";
labelTemplate.fillOpacity = 0.7;

var series = chart.series.push(new am4plugins_timeline.CurveColumnSeries());
series.dataFields.valueX = "value";
series.dataFields.categoryY = "category";

var columnTemplate = series.columns.template;
series.tooltipText = "{categoryY}: {valueX} kisses";
columnTemplate.adapter.add("fill", function (fill, target) {
  return chart.colors.getIndex(target.dataItem.index * 2);
})
columnTemplate.strokeOpacity = 0;
columnTemplate.fillOpacity = 0.8;

var hoverState = columnTemplate.states.create("hover")
hoverState.properties.fillOpacity = 1;


chart.scrollbarX = new am4core.Scrollbar();
chart.scrollbarX.align = "center"
chart.scrollbarX.width = am4core.percent(70);
chart.isMeasured = false;

var cursor = new am4plugins_timeline.CurveCursor();
chart.cursor = cursor;
cursor.xAxis = valueAxis;
cursor.yAxis = categoryAxis;
cursor.lineY.disabled = true;
cursor.lineX.strokeDasharray = "1,4";
cursor.lineX.strokeOpacity = 1;

var label = chart.plotContainer.createChild(am4core.Label);
label.text = "Biggest kissers in Friends"
label.fontSize = 15;
label.x = am4core.percent(80);
label.y = am4core.percent(80);
label.horizontalCenter = "right";

}); // end am4core.ready()
</script>

<!-- HTML -->
<div id="chartdiv"></div>