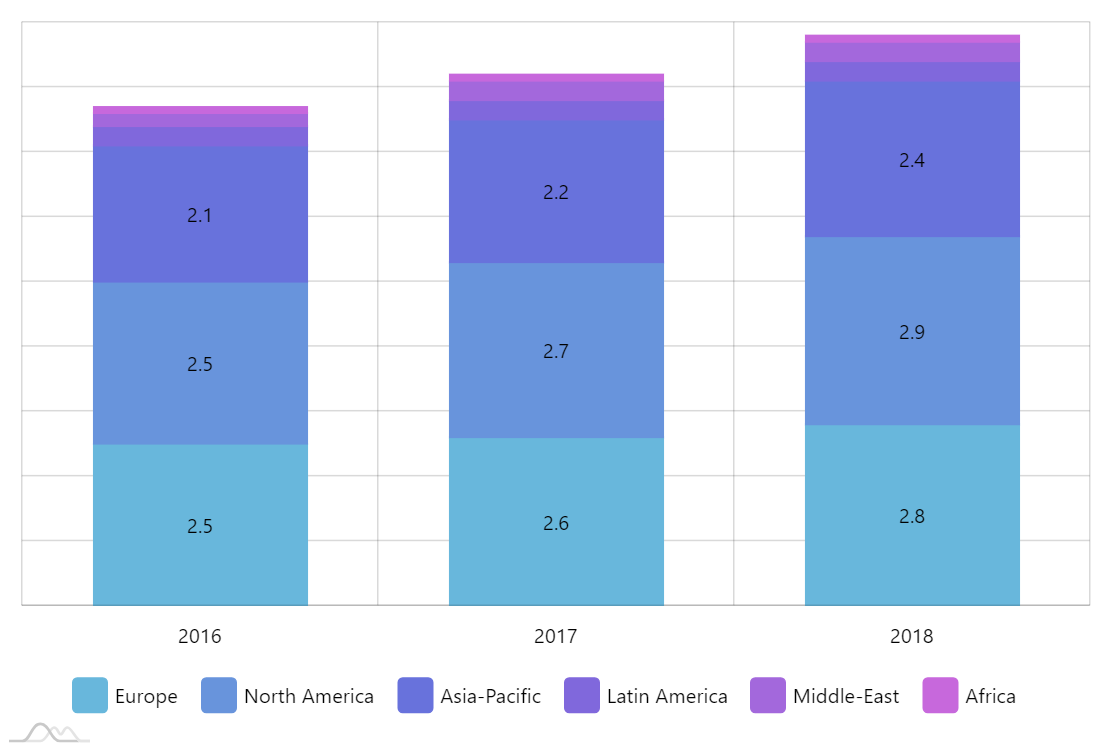
Stacked Column Chart
Stacked bar charts are useful to demonstrate how a larger data category is comprised of smaller categories, and what part each of the smaller categories plays in the total of a larger one.
Demo source
<!-- Styles -->
<style>
#chartdiv {
  width: 100%;
  height: 500px;
}
</style>

<!-- Resources -->
<script src="https://cdn.amcharts.com/lib/4/core.js"></script>
<script src="https://cdn.amcharts.com/lib/4/charts.js"></script>
<script src="https://cdn.amcharts.com/lib/4/themes/animated.js"></script>

<!-- Chart code -->
<script>
am4core.ready(function() {

// Themes begin
am4core.useTheme(am4themes_animated);
// Themes end

// Create chart instance
var chart = am4core.create("chartdiv", am4charts.XYChart);


// Add data
chart.data = [{
  "year": "2016",
  "europe": 2.5,
  "namerica": 2.5,
  "asia": 2.1,
  "lamerica": 0.3,
  "meast": 0.2,
  "africa": 0.1
}, {
  "year": "2017",
  "europe": 2.6,
  "namerica": 2.7,
  "asia": 2.2,
  "lamerica": 0.3,
  "meast": 0.3,
  "africa": 0.1
}, {
  "year": "2018",
  "europe": 2.8,
  "namerica": 2.9,
  "asia": 2.4,
  "lamerica": 0.3,
  "meast": 0.3,
  "africa": 0.1
}];

// Create axes
var categoryAxis = chart.xAxes.push(new am4charts.CategoryAxis());
categoryAxis.dataFields.category = "year";
categoryAxis.renderer.grid.template.location = 0;


var valueAxis = chart.yAxes.push(new am4charts.ValueAxis());
valueAxis.renderer.inside = true;
valueAxis.renderer.labels.template.disabled = true;
valueAxis.min = 0;

// Create series
function createSeries(field, name) {

  // Set up series
  var series = chart.series.push(new am4charts.ColumnSeries());
  series.name = name;
  series.dataFields.valueY = field;
  series.dataFields.categoryX = "year";
  series.sequencedInterpolation = true;

  // Make it stacked
  series.stacked = true;

  // Configure columns
  series.columns.template.width = am4core.percent(60);
  series.columns.template.tooltipText = "[bold]{name}[/]\n[font-size:14px]{categoryX}: {valueY}";

  // Add label
  var labelBullet = series.bullets.push(new am4charts.LabelBullet());
  labelBullet.label.text = "{valueY}";
  labelBullet.locationY = 0.5;
  labelBullet.label.hideOversized = true;

  return series;
}

createSeries("europe", "Europe");
createSeries("namerica", "North America");
createSeries("asia", "Asia-Pacific");
createSeries("lamerica", "Latin America");
createSeries("meast", "Middle-East");
createSeries("africa", "Africa");

// Legend
chart.legend = new am4charts.Legend();

}); // end am4core.ready()
</script>

<!-- HTML -->
<div id="chartdiv"></div>