Step Line Without Risers
Step start and end position control
You can control exactly where within category/date each step starts and ends using series’ startLocation and endLocation.
More information about step series
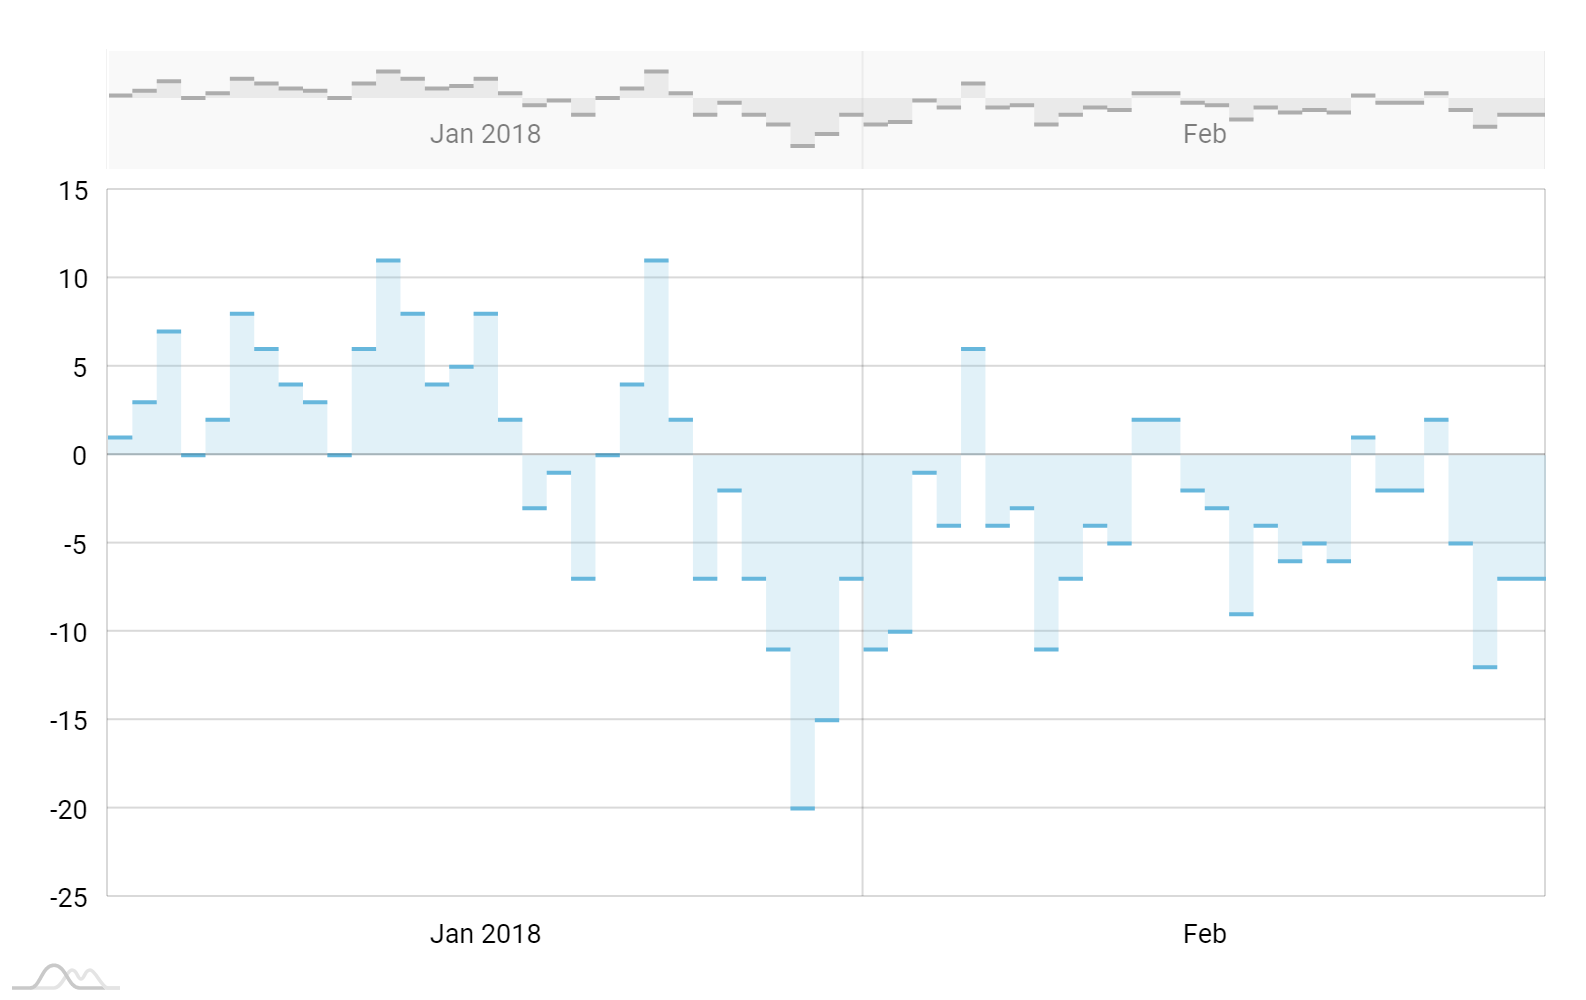
Step series without risers
Step line series can display just horizontal lines, without vertical connectors. For that just set its noRisers property to false.
Series in a scrollbar
The scrollbar used for zooming of the chart can depict a “small version” of chart’s actual series. More than one series can be added to the scrollbar.
More information about XY chart scrollbar
Demo source
<!-- Styles -->
<style>
#chartdiv {
  width: 100%;
  height: 500px;
}

</style>

<!-- Resources -->
<script src="https://cdn.amcharts.com/lib/4/core.js"></script>
<script src="https://cdn.amcharts.com/lib/4/charts.js"></script>
<script src="https://cdn.amcharts.com/lib/4/themes/animated.js"></script>

<!-- Chart code -->
<script>
am4core.ready(function() {

// Themes begin
am4core.useTheme(am4themes_animated);
// Themes end

// Create chart
var chart = am4core.create("chartdiv", am4charts.XYChart);
chart.hiddenState.properties.opacity = 0; // this makes initial fade in effect

chart.paddingRight = 20;

var data = [];
var visits = 10;
for (var i = 1; i < 60; i++) {
    visits += Math.round((Math.random() < 0.5 ? 1 : -1) * Math.random() * 10);
    data.push({ date: new Date(2018, 0, i), value: visits });
}

chart.data = data;

var dateAxis = chart.xAxes.push(new am4charts.DateAxis());
dateAxis.renderer.grid.template.location = 0;

var valueAxis = chart.yAxes.push(new am4charts.ValueAxis());
valueAxis.tooltip.disabled = true;
valueAxis.renderer.minWidth = 35;

var series = chart.series.push(new am4charts.StepLineSeries());
series.dataFields.dateX = "date";
series.dataFields.valueY = "value";
series.noRisers = true;
series.strokeWidth = 2;
series.fillOpacity = 0.2;
series.sequencedInterpolation = true;

series.tooltipText = "{valueY.value}";
chart.cursor = new am4charts.XYCursor();

chart.scrollbarX = new am4charts.XYChartScrollbar();
chart.scrollbarX.series.push(series);

}); // end am4core.ready()
</script>

<!-- HTML -->
<div id="chartdiv"></div>