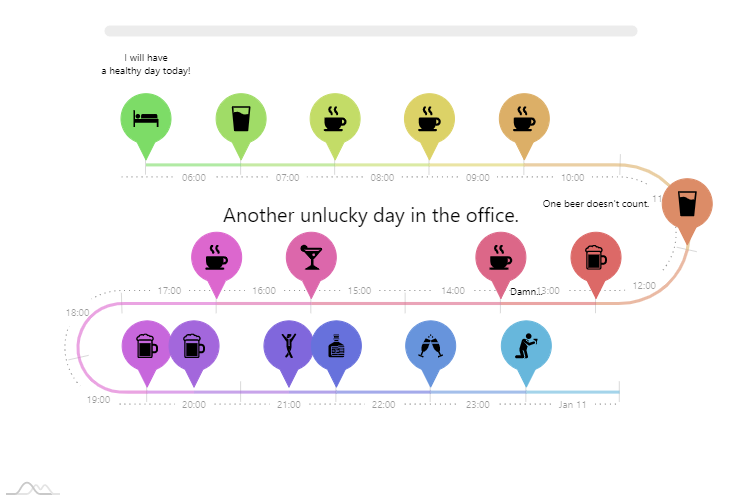
This demo uses amCharts 4 TimeLine add-on. This type of chart is sometimes called a linear process diagram.
JavaScript TypeScript / ES6 JSON ...
<style >
#chartdiv {
width : 100% ;
height : 600px ;
}
</style >
<script src ="https://cdn.amcharts.com/lib/4/core.js" > </script >
<script src ="https://cdn.amcharts.com/lib/4/charts.js" > </script >
<script src ="https://cdn.amcharts.com/lib/4/plugins/timeline.js" > </script >
<script src ="https://cdn.amcharts.com/lib/4/plugins/bullets.js" > </script >
<script src ="https://cdn.amcharts.com/lib/4/themes/animated.js" > </script >
<script >
am4core.ready (function (useTheme (am4themes_animated);
var chart = am4core.create ("chartdiv" , am4plugins_timeline.SerpentineChart );
chart.curveContainer .padding (100 , 20 , 50 , 20 );
chart.levelCount = 3 ;
chart.yAxisRadius = am4core.percent (20 );
chart.yAxisInnerRadius = am4core.percent (2 );
chart.maskBullets = false ;
var colorSet = new am4core.ColorSet ();
chart.dateFormatter .inputDateFormat = "yyyy-MM-dd HH:mm" ;
chart.dateFormatter .dateFormat = "HH" ;
chart.data = [{
"category" : "" ,
"start" : "2019-01-10 06:00" ,
"end" : "2019-01-10 07:00" ,
"color" : colorSet.getIndex (15 ),
"text" : "I will have\na healthy day today!" ,
"textDisabled" : false ,
"icon" : "/wp-content/uploads/assets/timeline/timeline0.svg"
}, {
"category" : "" ,
"start" : "2019-01-10 07:00" ,
"end" : "2019-01-10 08:00" ,
"color" : colorSet.getIndex (14 ),
"icon" : "/wp-content/uploads/assets/timeline/timeline1.svg"
},
{
"category" : "" ,
"start" : "2019-01-10 08:00" ,
"end" : "2019-01-10 09:00" ,
"color" : colorSet.getIndex (13 ),
"icon" : "/wp-content/uploads/assets/timeline/timeline2.svg"
},
{
"category" : "" ,
"start" : "2019-01-10 09:00" ,
"end" : "2019-01-10 10:00" ,
"color" : colorSet.getIndex (12 ),
"icon" : "/wp-content/uploads/assets/timeline/timeline2.svg"
},
{
"category" : "" ,
"start" : "2019-01-10 10:00" ,
"end" : "2019-01-10 12:00" ,
"color" : colorSet.getIndex (11 ),
"icon" : "/wp-content/uploads/assets/timeline/timeline2.svg"
},
{
"category" : "" ,
"start" : "2019-01-10 12:00" ,
"end" : "2019-01-10 13:00" ,
"color" : colorSet.getIndex (10 ),
"icon" : "/wp-content/uploads/assets/timeline/timeline1.svg"
},
{
"category" : "" ,
"start" : "2019-01-10 13:00" ,
"end" : "2019-01-10 14:00" ,
"color" : colorSet.getIndex (9 ),
"text" : "One beer doesn't count." ,
"textDisabled" : false ,
"icon" : "/wp-content/uploads/assets/timeline/timeline3.svg"
},
{
"category" : "" ,
"start" : "2019-01-10 14:00" ,
"end" : "2019-01-10 16:00" ,
"color" : colorSet.getIndex (8 ),
"icon" : "/wp-content/uploads/assets/timeline/timeline2.svg"
},
{
"category" : "" ,
"start" : "2019-01-10 16:00" ,
"end" : "2019-01-10 17:00" ,
"color" : colorSet.getIndex (7 ),
"icon" : "/wp-content/uploads/assets/timeline/timeline4.svg"
},
{
"category" : "" ,
"start" : "2019-01-10 17:00" ,
"end" : "2019-01-10 20:00" ,
"color" : colorSet.getIndex (6 ),
"icon" : "/wp-content/uploads/assets/timeline/timeline2.svg"
},
{
"category" : "" ,
"start" : "2019-01-10 20:00" ,
"end" : "2019-01-10 20:30" ,
"color" : colorSet.getIndex (5 ),
"icon" : "/wp-content/uploads/assets/timeline/timeline3.svg"
},
{
"category" : "" ,
"start" : "2019-01-10 20:30" ,
"end" : "2019-01-10 21:30" ,
"color" : colorSet.getIndex (4 ),
"icon" : "/wp-content/uploads/assets/timeline/timeline3.svg"
},
{
"category" : "" ,
"start" : "2019-01-10 21:30" ,
"end" : "2019-01-10 22:00" ,
"color" : colorSet.getIndex (3 ),
"icon" : "/wp-content/uploads/assets/timeline/dance.svg"
},
{
"category" : "" ,
"start" : "2019-01-10 22:00" ,
"end" : "2019-01-10 23:00" ,
"color" : colorSet.getIndex (2 ),
"icon" : "/wp-content/uploads/assets/timeline/timeline5.svg"
},
{
"category" : "" ,
"start" : "2019-01-10 23:00" ,
"end" : "2019-01-11 00:00" ,
"color" : colorSet.getIndex (1 ),
"icon" : "/wp-content/uploads/assets/timeline/timeline6.svg"
},
{
"category" : "" ,
"start" : "2019-01-11 00:00" ,
"end" : "2019-01-11 01:00" ,
"color" : colorSet.getIndex (0 ),
"text" : "Damn..." ,
"textDisabled" : false ,
"icon" : "/wp-content/uploads/assets/timeline/timeline7.svg"
}];
chart.fontSize = 10 ;
chart.tooltipContainer .fontSize = 10 ;
var categoryAxis = chart.yAxes .push (new am4charts.CategoryAxis ());
categoryAxis.dataFields .category = "category" ;
categoryAxis.renderer .grid .template .disabled = true ;
categoryAxis.renderer .labels .template .paddingRight = 25 ;
categoryAxis.renderer .minGridDistance = 10 ;
var dateAxis = chart.xAxes .push (new am4charts.DateAxis ());
dateAxis.renderer .minGridDistance = 70 ;
dateAxis.baseInterval = { count : 30 , timeUnit : "minute" };
dateAxis.renderer .tooltipLocation = 0 ;
dateAxis.renderer .line .strokeDasharray = "1,4" ;
dateAxis.renderer .line .strokeOpacity = 0.5 ;
dateAxis.tooltip .background .fillOpacity = 0.2 ;
dateAxis.tooltip .background .cornerRadius = 5 ;
dateAxis.tooltip .label .fill = new am4core.InterfaceColorSet ().getFor ("alternativeBackground" );
dateAxis.tooltip .label .paddingTop = 7 ;
dateAxis.endLocation = 0 ;
dateAxis.startLocation = -0.5 ;
var labelTemplate = dateAxis.renderer .labels .template ;
labelTemplate.verticalCenter = "middle" ;
labelTemplate.fillOpacity = 0.4 ;
labelTemplate.background .fill = new am4core.InterfaceColorSet ().getFor ("background" );
labelTemplate.background .fillOpacity = 1 ;
labelTemplate.padding (7 , 7 , 7 , 7 );
var series = chart.series .push (new am4plugins_timeline.CurveColumnSeries ());
series.columns .template .height = am4core.percent (15 );
series.dataFields .openDateX = "start" ;
series.dataFields .dateX = "end" ;
series.dataFields .categoryY = "category" ;
series.baseAxis = categoryAxis;
series.columns .template .propertyFields .fill = "color" ;
series.columns .template .propertyFields .stroke = "color" ;
series.columns .template .strokeOpacity = 0 ;
series.columns .template .fillOpacity = 0.6 ;
var imageBullet1 = series.bullets .push (new am4plugins_bullets.PinBullet ());
imageBullet1.locationX = 1 ;
imageBullet1.propertyFields .stroke = "color" ;
imageBullet1.background .propertyFields .fill = "color" ;
imageBullet1.image = new am4core.Image ();
imageBullet1.image .propertyFields .href = "icon" ;
imageBullet1.image .scale = 0.5 ;
imageBullet1.circle .radius = am4core.percent (100 );
imageBullet1.dy = -5 ;
var textBullet = series.bullets .push (new am4charts.LabelBullet ());
textBullet.label .propertyFields .text = "text" ;
textBullet.disabled = true ;
textBullet.propertyFields .disabled = "textDisabled" ;
textBullet.label .strokeOpacity = 0 ;
textBullet.locationX = 1 ;
textBullet.dy = - 100 ;
textBullet.label .textAlign = "middle" ;
chart.scrollbarX = new am4core.Scrollbar ();
chart.scrollbarX .align = "center"
chart.scrollbarX .width = am4core.percent (75 );
chart.scrollbarX .opacity = 0.5 ;
var cursor = new am4plugins_timeline.CurveCursor ();
chart.cursor = cursor;
cursor.xAxis = dateAxis;
cursor.yAxis = categoryAxis;
cursor.lineY .disabled = true ;
cursor.lineX .strokeDasharray = "1,4" ;
cursor.lineX .strokeOpacity = 1 ;
dateAxis.renderer .tooltipLocation2 = 0 ;
categoryAxis.cursorTooltipEnabled = false ;
var label = chart.createChild (am4core.Label );
label.text = "Another unlucky day in the office."
label.isMeasured = false ;
label.y = am4core.percent (40 );
label.x = am4core.percent (50 );
label.horizontalCenter = "middle" ;
label.fontSize = 20 ;
});
</script >
<div id ="chartdiv" > </div >
import * as am4core from "@amcharts/amcharts4/core" ;
import * as am4charts from "@amcharts/amcharts4/charts" ;
import am4themes_animated from "@amcharts/amcharts4/themes/animated" ;
am4core.useTheme (am4themes_animated);
let chart = am4core.create ("chartdiv" , am4plugins_timeline.SerpentineChart );
chart.curveContainer .padding (100 , 20 , 50 , 20 );
chart.levelCount = 3 ;
chart.yAxisRadius = am4core.percent (20 );
chart.yAxisInnerRadius = am4core.percent (2 );
chart.maskBullets = false ;
let colorSet = new am4core.ColorSet ();
chart.dateFormatter .inputDateFormat = "yyyy-MM-dd HH:mm" ;
chart.dateFormatter .dateFormat = "HH" ;
chart.data = [{
"category" : "" ,
"start" : "2019-01-10 06:00" ,
"end" : "2019-01-10 07:00" ,
"color" : colorSet.getIndex (15 ),
"text" : "I will have\na healthy day today!" ,
"textDisabled" : false ,
"icon" : "/wp-content/uploads/assets/timeline/timeline0.svg"
}, {
"category" : "" ,
"start" : "2019-01-10 07:00" ,
"end" : "2019-01-10 08:00" ,
"color" : colorSet.getIndex (14 ),
"icon" : "/wp-content/uploads/assets/timeline/timeline1.svg"
},
{
"category" : "" ,
"start" : "2019-01-10 08:00" ,
"end" : "2019-01-10 09:00" ,
"color" : colorSet.getIndex (13 ),
"icon" : "/wp-content/uploads/assets/timeline/timeline2.svg"
},
{
"category" : "" ,
"start" : "2019-01-10 09:00" ,
"end" : "2019-01-10 10:00" ,
"color" : colorSet.getIndex (12 ),
"icon" : "/wp-content/uploads/assets/timeline/timeline2.svg"
},
{
"category" : "" ,
"start" : "2019-01-10 10:00" ,
"end" : "2019-01-10 12:00" ,
"color" : colorSet.getIndex (11 ),
"icon" : "/wp-content/uploads/assets/timeline/timeline2.svg"
},
{
"category" : "" ,
"start" : "2019-01-10 12:00" ,
"end" : "2019-01-10 13:00" ,
"color" : colorSet.getIndex (10 ),
"icon" : "/wp-content/uploads/assets/timeline/timeline1.svg"
},
{
"category" : "" ,
"start" : "2019-01-10 13:00" ,
"end" : "2019-01-10 14:00" ,
"color" : colorSet.getIndex (9 ),
"text" : "One beer doesn't count." ,
"textDisabled" : false ,
"icon" : "/wp-content/uploads/assets/timeline/timeline3.svg"
},
{
"category" : "" ,
"start" : "2019-01-10 14:00" ,
"end" : "2019-01-10 16:00" ,
"color" : colorSet.getIndex (8 ),
"icon" : "/wp-content/uploads/assets/timeline/timeline2.svg"
},
{
"category" : "" ,
"start" : "2019-01-10 16:00" ,
"end" : "2019-01-10 17:00" ,
"color" : colorSet.getIndex (7 ),
"icon" : "/wp-content/uploads/assets/timeline/timeline4.svg"
},
{
"category" : "" ,
"start" : "2019-01-10 17:00" ,
"end" : "2019-01-10 20:00" ,
"color" : colorSet.getIndex (6 ),
"icon" : "/wp-content/uploads/assets/timeline/timeline2.svg"
},
{
"category" : "" ,
"start" : "2019-01-10 20:00" ,
"end" : "2019-01-10 20:30" ,
"color" : colorSet.getIndex (5 ),
"icon" : "/wp-content/uploads/assets/timeline/timeline3.svg"
},
{
"category" : "" ,
"start" : "2019-01-10 20:30" ,
"end" : "2019-01-10 21:30" ,
"color" : colorSet.getIndex (4 ),
"icon" : "/wp-content/uploads/assets/timeline/timeline3.svg"
},
{
"category" : "" ,
"start" : "2019-01-10 21:30" ,
"end" : "2019-01-10 22:00" ,
"color" : colorSet.getIndex (3 ),
"icon" : "/wp-content/uploads/assets/timeline/dance.svg"
},
{
"category" : "" ,
"start" : "2019-01-10 22:00" ,
"end" : "2019-01-10 23:00" ,
"color" : colorSet.getIndex (2 ),
"icon" : "/wp-content/uploads/assets/timeline/timeline5.svg"
},
{
"category" : "" ,
"start" : "2019-01-10 23:00" ,
"end" : "2019-01-11 00:00" ,
"color" : colorSet.getIndex (1 ),
"icon" : "/wp-content/uploads/assets/timeline/timeline6.svg"
},
{
"category" : "" ,
"start" : "2019-01-11 00:00" ,
"end" : "2019-01-11 01:00" ,
"color" : colorSet.getIndex (0 ),
"text" : "Damn..." ,
"textDisabled" : false ,
"icon" : "/wp-content/uploads/assets/timeline/timeline7.svg"
}];
chart.fontSize = 10 ;
chart.tooltipContainer .fontSize = 10 ;
let categoryAxis = chart.yAxes .push (new am4charts.CategoryAxis ());
categoryAxis.dataFields .category = "category" ;
categoryAxis.renderer .grid .template .disabled = true ;
categoryAxis.renderer .labels .template .paddingRight = 25 ;
categoryAxis.renderer .minGridDistance = 10 ;
let dateAxis = chart.xAxes .push (new am4charts.DateAxis ());
dateAxis.renderer .minGridDistance = 70 ;
dateAxis.baseInterval = { count : 30 , timeUnit : "minute" };
dateAxis.renderer .tooltipLocation = 0 ;
dateAxis.renderer .line .strokeDasharray = "1,4" ;
dateAxis.renderer .line .strokeOpacity = 0.5 ;
dateAxis.tooltip .background .fillOpacity = 0.2 ;
dateAxis.tooltip .background .cornerRadius = 5 ;
dateAxis.tooltip .label .fill = new am4core.InterfaceColorSet ().getFor ("alternativeBackground" );
dateAxis.tooltip .label .paddingTop = 7 ;
dateAxis.endLocation = 0 ;
dateAxis.startLocation = -0.5 ;
let labelTemplate = dateAxis.renderer .labels .template ;
labelTemplate.verticalCenter = "middle" ;
labelTemplate.fillOpacity = 0.4 ;
labelTemplate.background .fill = new am4core.InterfaceColorSet ().getFor ("background" );
labelTemplate.background .fillOpacity = 1 ;
labelTemplate.padding (7 , 7 , 7 , 7 );
let series = chart.series .push (new am4plugins_timeline.CurveColumnSeries ());
series.columns .template .height = am4core.percent (15 );
series.dataFields .openDateX = "start" ;
series.dataFields .dateX = "end" ;
series.dataFields .categoryY = "category" ;
series.baseAxis = categoryAxis;
series.columns .template .propertyFields .fill = "color" ;
series.columns .template .propertyFields .stroke = "color" ;
series.columns .template .strokeOpacity = 0 ;
series.columns .template .fillOpacity = 0.6 ;
let imageBullet1 = series.bullets .push (new am4plugins_bullets.PinBullet ());
imageBullet1.locationX = 1 ;
imageBullet1.propertyFields .stroke = "color" ;
imageBullet1.background .propertyFields .fill = "color" ;
imageBullet1.image = new am4core.Image ();
imageBullet1.image .propertyFields .href = "icon" ;
imageBullet1.image .scale = 0.5 ;
imageBullet1.circle .radius = am4core.percent (100 );
imageBullet1.dy = -5 ;
let textBullet = series.bullets .push (new am4charts.LabelBullet ());
textBullet.label .propertyFields .text = "text" ;
textBullet.disabled = true ;
textBullet.propertyFields .disabled = "textDisabled" ;
textBullet.label .strokeOpacity = 0 ;
textBullet.locationX = 1 ;
textBullet.dy = - 100 ;
textBullet.label .textAlign = "middle" ;
chart.scrollbarX = new am4core.Scrollbar ();
chart.scrollbarX .align = "center"
chart.scrollbarX .width = am4core.percent (75 );
chart.scrollbarX .opacity = 0.5 ;
let cursor = new am4plugins_timeline.CurveCursor ();
chart.cursor = cursor;
cursor.xAxis = dateAxis;
cursor.yAxis = categoryAxis;
cursor.lineY .disabled = true ;
cursor.lineX .strokeDasharray = "1,4" ;
cursor.lineX .strokeOpacity = 1 ;
dateAxis.renderer .tooltipLocation2 = 0 ;
categoryAxis.cursorTooltipEnabled = false ;
let label = chart.createChild (am4core.Label );
label.text = "Another unlucky day in the office."
label.isMeasured = false ;
label.y = am4core.percent (40 );
label.x = am4core.percent (50 );
label.horizontalCenter = "middle" ;
label.fontSize = 20 ;
<style >
#chartdiv {
width : 100% ;
height : 600px ;
}
</style >
<script src ="https://cdn.amcharts.com/lib/4/core.js" > </script >
<script src ="https://cdn.amcharts.com/lib/4/charts.js" > </script >
<script src ="https://cdn.amcharts.com/lib/4/plugins/timeline.js" > </script >
<script src ="https://cdn.amcharts.com/lib/4/plugins/bullets.js" > </script >
<script src ="https://cdn.amcharts.com/lib/4/themes/animated.js" > </script >
<script >
am4core.useTheme (am4themes_animated);
var chart = am4core.createFromConfig ({
"curveContainer" : {
"paddingTop" : 100 ,
"paddingRight" : 20 ,
"paddingBottom" : 50 ,
"paddingLeft" : 20
},
"levelCount" : 3 ,
"yAxisRadius" : "20%" ,
"yAxisInnerRadius" : "2%" ,
"maskBullets" : false ,
"fontSize" : 10 ,
"tooltipContainer" : {
"fontSize" : 10
},
"dateFormatter" : {
"inputDateFormat" : "yyyy-MM-dd HH:mm" ,
"dateFormat" : "HH"
},
"yAxes" : [{
"type" : "CategoryAxis" ,
"id" : "a1" ,
"cursorTooltipEnabled" : false ,
"dataFields" : {
"category" : "category"
},
"renderer" : {
"grid" : {
"disabled" : true
},
"labels" : {
"paddingRight" : 25
},
"minGridDistance" : 10
}
}],
"xAxes" : [{
"type" : "DateAxis" ,
"id" : "a2" ,
"endLocation" : 0 ,
"startLocation" : -0.5 ,
"baseInterval" : { count : 30 , timeUnit : "minute" },
"tooltipLocation2" : 0 ,
"renderer" : {
"minGridDistance" : 70 ,
"tooltipLocation" : 0 ,
"line" : {
"strokeDasharray" : "1,4" ,
"strokeOpacity" : 0.5
},
"labels" : {
"verticalCenter" : "middle" ,
"fillOpacity" : 0.4 ,
"paddingTop" : 7 ,
"paddingRight" : 7 ,
"paddingBottom" : 7 ,
"paddingLeft" : 7 ,
"background" : {
"fill" : "#fff" ,
"fillOpacity" : 1
}
}
},
"tooltip" : {
"background" : {
"fillOpacity" : 0.2 ,
"cornerRadius" : 5
},
"label" : {
"fill" : "#000" ,
"paddingTop" : 7
}
}
}],
"series" : [{
"type" : "CurveColumnSeries" ,
"baseAxis" : "a1" ,
"dataFields" : {
"openDateX" : "start" ,
"dateX" : "end" ,
"categoryY" : "category"
},
"columns" : {
"height" : "15%" ,
"strokeOpacity" : 0 ,
"fillOpacity" : 0.6 ,
"propertyFields" : {
"fill" : "color" ,
"stroke" : "color"
}
},
"bullets" : [{
"type" : "PinBullet" ,
"locationX" : 1 ,
"dy" : -5 ,
"propertyFields" : {
"stroke" : "color"
},
"background" : {
"propertyFields" : {
"fill" : "color"
}
},
"image" : {
"type" : "Image" ,
"scale" : 0.5 ,
"propertyFields" : {
"href" : "icon"
}
},
"circle" : {
"radius" : "100%"
}
}, {
"type" : "LabelBullet" ,
"locationX" : 1 ,
"dy" : -100 ,
"disabled" : true ,
"propertyFields" : {
"disabled" : "textDisabled"
},
"label" : {
"strokeOpacity" : 0 ,
"textAlign" : "middle" ,
"propertyFields" : {
"text" : "text"
}
}
}]
}],
"scrollbarX" : {
"type" : "Scrollbar" ,
"align" : "center" ,
"width" : "75%" ,
"opacity" : 0.5
},
"cursor" : {
"type" : "CurveCursor" ,
"xAxis" : "a2" ,
"yAxis" : "a1" ,
"lineY" : {
"disabled" : true
},
"lineX" : {
"strokeDasharray" : "1,4" ,
"strokeOpacity" : 1
}
},
"children" : [{
"type" : "Label" ,
"forceCreate" : true ,
"text" : "Another unlucky day in the office." ,
"isMeasured" : false ,
"y" : "40%" ,
"x" : "50%" ,
"horizontalCenter" : "middle" ,
"fontSize" : 20
}],
"data" : [{
"category" : "" ,
"start" : "2019-01-10 06:00" ,
"end" : "2019-01-10 07:00" ,
"color" : "#7ddc67" ,
"text" : "I will have\na healthy day today!" ,
"textDisabled" : false ,
"icon" : "https://www.amcharts.com/wp-content/uploads/assets/timeline/timeline0.svg"
}, {
"category" : "" ,
"start" : "2019-01-10 07:00" ,
"end" : "2019-01-10 08:00" ,
"color" : "#a0dc67" ,
"icon" : "https://www.amcharts.com/wp-content/uploads/assets/timeline/timeline1.svg"
}, {
"category" : "" ,
"start" : "2019-01-10 08:00" ,
"end" : "2019-01-10 09:00" ,
"color" : "#c3dc67" ,
"icon" : "https://www.amcharts.com/wp-content/uploads/assets/timeline/timeline2.svg"
}, {
"category" : "" ,
"start" : "2019-01-10 09:00" ,
"end" : "2019-01-10 10:00" ,
"color" : "#dcd267" ,
"icon" : "https://www.amcharts.com/wp-content/uploads/assets/timeline/timeline2.svg"
}, {
"category" : "" ,
"start" : "2019-01-10 10:00" ,
"end" : "2019-01-10 12:00" ,
"color" : "#dcaf67" ,
"icon" : "https://www.amcharts.com/wp-content/uploads/assets/timeline/timeline2.svg"
}, {
"category" : "" ,
"start" : "2019-01-10 12:00" ,
"end" : "2019-01-10 13:00" ,
"color" : "#dc8c67" ,
"icon" : "https://www.amcharts.com/wp-content/uploads/assets/timeline/timeline1.svg"
}, {
"category" : "" ,
"start" : "2019-01-10 13:00" ,
"end" : "2019-01-10 14:00" ,
"color" : "#dc6967" ,
"text" : "One beer doesn't count." ,
"textDisabled" : false ,
"icon" : "https://www.amcharts.com/wp-content/uploads/assets/timeline/timeline3.svg"
}, {
"category" : "" ,
"start" : "2019-01-10 14:00" ,
"end" : "2019-01-10 16:00" ,
"color" : "#dc6788" ,
"icon" : "https://www.amcharts.com/wp-content/uploads/assets/timeline/timeline2.svg"
}, {
"category" : "" ,
"start" : "2019-01-10 16:00" ,
"end" : "2019-01-10 17:00" ,
"color" : "#dc67ab" ,
"icon" : "https://www.amcharts.com/wp-content/uploads/assets/timeline/timeline4.svg"
}, {
"category" : "" ,
"start" : "2019-01-10 17:00" ,
"end" : "2019-01-10 20:00" ,
"color" : "#dc67ce" ,
"icon" : "https://www.amcharts.com/wp-content/uploads/assets/timeline/timeline2.svg"
}, {
"category" : "" ,
"start" : "2019-01-10 20:00" ,
"end" : "2019-01-10 20:30" ,
"color" : "#c767dc" ,
"icon" : "https://www.amcharts.com/wp-content/uploads/assets/timeline/timeline3.svg"
}, {
"category" : "" ,
"start" : "2019-01-10 20:30" ,
"end" : "2019-01-10 21:30" ,
"color" : "#a367dc" ,
"icon" : "https://www.amcharts.com/wp-content/uploads/assets/timeline/timeline3.svg"
}, {
"category" : "" ,
"start" : "2019-01-10 21:30" ,
"end" : "2019-01-10 22:00" ,
"color" : "#8067dc" ,
"icon" : "https://www.amcharts.com/wp-content/uploads/assets/timeline/dance.svg"
}, {
"category" : "" ,
"start" : "2019-01-10 22:00" ,
"end" : "2019-01-10 23:00" ,
"color" : "#6771dc" ,
"icon" : "https://www.amcharts.com/wp-content/uploads/assets/timeline/timeline5.svg"
}, {
"category" : "" ,
"start" : "2019-01-10 23:00" ,
"end" : "2019-01-11 00:00" ,
"color" : "#6794dc" ,
"icon" : "https://www.amcharts.com/wp-content/uploads/assets/timeline/timeline6.svg"
}, {
"category" : "" ,
"start" : "2019-01-11 00:00" ,
"end" : "2019-01-11 01:00" ,
"color" : "#67b7dc" ,
"text" : "Damn..." ,
"textDisabled" : false ,
"icon" : "https://www.amcharts.com/wp-content/uploads/assets/timeline/timeline7.svg"
}],
}, "chartdiv" , am4plugins_timeline.SerpentineChart );
</script >
<div id ="chartdiv" > </div >