JavaScript TypeScript / ES6 ...
<style >
#chartdiv {
width : 100% ;
height : 500px ;
}
</style >
<script src ="https://cdn.amcharts.com/lib/4/core.js" > </script >
<script src ="https://cdn.amcharts.com/lib/4/charts.js" > </script >
<script src ="https://cdn.amcharts.com/lib/4/themes/animated.js" > </script >
<script >
am4core.ready (function (useTheme (am4themes_animated);
var chart = am4core.create ("chartdiv" , am4charts.XYChart );
chart.cursor = new am4charts.XYCursor ();
chart.cursor .lineX .disabled = true ;
chart.cursor .lineY .disabled = true ;
chart.scrollbarX = new am4core.Scrollbar ();
chart.data = [{
"date" : "2012-01-01" ,
"value" : 8
}, {
"date" : "2012-01-02" ,
"value" : 10
}, {
"date" : "2012-01-03" ,
"value" : 12
}, {
"date" : "2012-01-04" ,
"value" : 14
}, {
"date" : "2012-01-05" ,
"value" : 11
}, {
"date" : "2012-01-06" ,
"value" : 6
}, {
"date" : "2012-01-07" ,
"value" : 7
}, {
"date" : "2012-01-08" ,
"value" : 9
}, {
"date" : "2012-01-09" ,
"value" : 13
}, {
"date" : "2012-01-10" ,
"value" : 15
}, {
"date" : "2012-01-11" ,
"value" : 19
}, {
"date" : "2012-01-12" ,
"value" : 21
}, {
"date" : "2012-01-13" ,
"value" : 22
}, {
"date" : "2012-01-14" ,
"value" : 20
}, {
"date" : "2012-01-15" ,
"value" : 18
}, {
"date" : "2012-01-16" ,
"value" : 14
}, {
"date" : "2012-01-17" ,
"value" : 16 ,
"opacity" : 0
}, {
"date" : "2012-01-18" ,
"value" : 18
}, {
"date" : "2012-01-19" ,
"value" : 17
}, {
"date" : "2012-01-20" ,
"value" : 15
}, {
"date" : "2012-01-21" ,
"value" : 12
}, {
"date" : "2012-01-22" ,
"value" : 10
}, {
"date" : "2012-01-23" ,
"value" : 8
}];
var dateAxis = chart.xAxes .push (new am4charts.DateAxis ());
dateAxis.renderer .grid .template .location = 0.5 ;
dateAxis.dateFormatter .inputDateFormat = "yyyy-MM-dd" ;
dateAxis.renderer .minGridDistance = 40 ;
dateAxis.tooltipDateFormat = "MMM dd, yyyy" ;
dateAxis.dateFormats .setKey ("day" , "dd" );
var valueAxis = chart.yAxes .push (new am4charts.ValueAxis ());
var series = chart.series .push (new am4charts.LineSeries ());
series.tooltipText = "{date}\n[bold font-size: 17px]value: {valueY}[/]" ;
series.dataFields .valueY = "value" ;
series.dataFields .dateX = "date" ;
series.strokeDasharray = 3 ;
series.strokeWidth = 2
series.strokeOpacity = 0.3 ;
series.strokeDasharray = "3,3"
var bullet = series.bullets .push (new am4charts.CircleBullet ());
bullet.strokeWidth = 2 ;
bullet.stroke = am4core.color ("#fff" );
bullet.setStateOnChildren = true ;
bullet.propertyFields .fillOpacity = "opacity" ;
bullet.propertyFields .strokeOpacity = "opacity" ;
var hoverState = bullet.states .create ("hover" );
hoverState.properties .scale = 1.7 ;
function createTrendLine (data ) {
var trend = chart.series .push (new am4charts.LineSeries ());
trend.dataFields .valueY = "value" ;
trend.dataFields .dateX = "date" ;
trend.strokeWidth = 2
trend.stroke = trend.fill = am4core.color ("#c00" );
trend.data = data;
var bullet = trend.bullets .push (new am4charts.CircleBullet ());
bullet.tooltipText = "{date}\n[bold font-size: 17px]value: {valueY}[/]" ;
bullet.strokeWidth = 2 ;
bullet.stroke = am4core.color ("#fff" )
bullet.circle .fill = trend.stroke ;
var hoverState = bullet.states .create ("hover" );
hoverState.properties .scale = 1.7 ;
return trend;
};
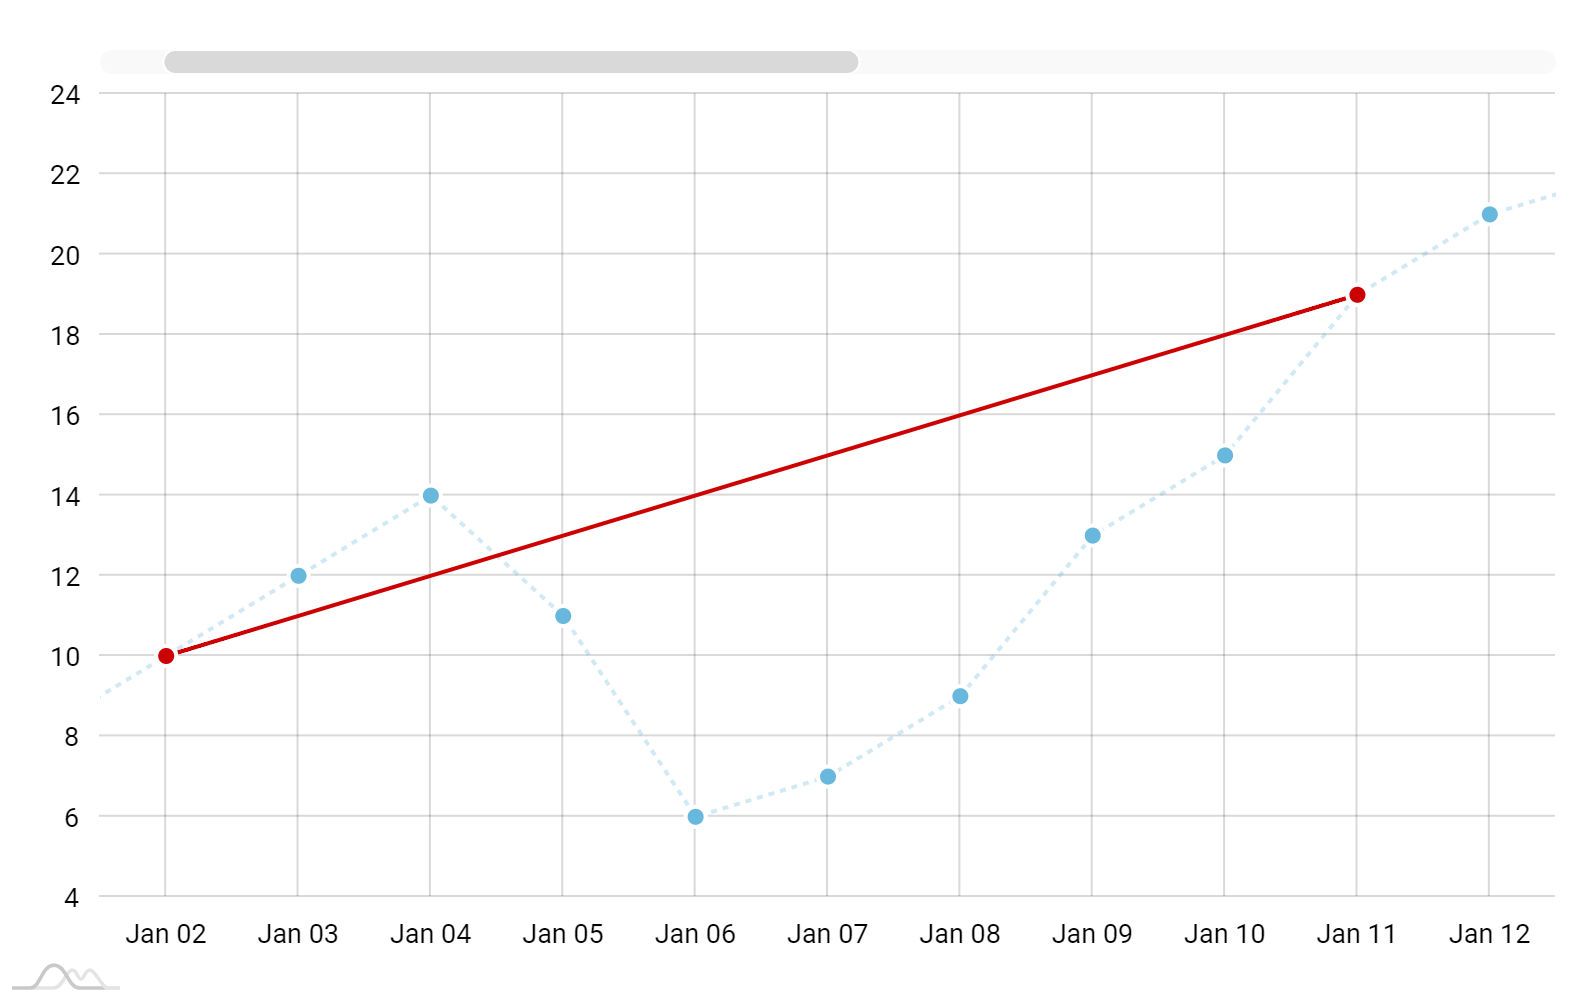
createTrendLine ([
{ "date" : "2012-01-02" , "value" : 10 },
{ "date" : "2012-01-11" , "value" : 19 }
]);
var lastTrend = createTrendLine ([
{ "date" : "2012-01-17" , "value" : 16 },
{ "date" : "2012-01-22" , "value" : 10 }
]);
lastTrend.events .once ("datavalidated" , function (xAxis .zoomToDates (new Date (2012 , 0 , 2 ), new Date (2012 , 0 , 13 ));
});
});
</script >
<div id ="chartdiv" > </div >
import * as am4core from "@amcharts/amcharts4/core" ;
import * as am4charts from "@amcharts/amcharts4/charts" ;
import am4themes_animated from "@amcharts/amcharts4/themes/animated" ;
am4core.useTheme (am4themes_animated);
let chart = am4core.create ("chartdiv" , am4charts.XYChart );
chart.cursor = new am4charts.XYCursor ();
chart.cursor .lineX .disabled = true ;
chart.cursor .lineY .disabled = true ;
chart.scrollbarX = new am4core.Scrollbar ();
chart.data = [{
"date" : "2012-01-01" ,
"value" : 8
}, {
"date" : "2012-01-02" ,
"value" : 10
}, {
"date" : "2012-01-03" ,
"value" : 12
}, {
"date" : "2012-01-04" ,
"value" : 14
}, {
"date" : "2012-01-05" ,
"value" : 11
}, {
"date" : "2012-01-06" ,
"value" : 6
}, {
"date" : "2012-01-07" ,
"value" : 7
}, {
"date" : "2012-01-08" ,
"value" : 9
}, {
"date" : "2012-01-09" ,
"value" : 13
}, {
"date" : "2012-01-10" ,
"value" : 15
}, {
"date" : "2012-01-11" ,
"value" : 19
}, {
"date" : "2012-01-12" ,
"value" : 21
}, {
"date" : "2012-01-13" ,
"value" : 22
}, {
"date" : "2012-01-14" ,
"value" : 20
}, {
"date" : "2012-01-15" ,
"value" : 18
}, {
"date" : "2012-01-16" ,
"value" : 14
}, {
"date" : "2012-01-17" ,
"value" : 16 ,
"opacity" : 0
}, {
"date" : "2012-01-18" ,
"value" : 18
}, {
"date" : "2012-01-19" ,
"value" : 17
}, {
"date" : "2012-01-20" ,
"value" : 15
}, {
"date" : "2012-01-21" ,
"value" : 12
}, {
"date" : "2012-01-22" ,
"value" : 10
}, {
"date" : "2012-01-23" ,
"value" : 8
}];
let dateAxis = chart.xAxes .push (new am4charts.DateAxis ());
dateAxis.renderer .grid .template .location = 0.5 ;
dateAxis.dateFormatter .inputDateFormat = "yyyy-MM-dd" ;
dateAxis.renderer .minGridDistance = 40 ;
dateAxis.tooltipDateFormat = "MMM dd, yyyy" ;
dateAxis.dateFormats .setKey ("day" , "dd" );
let valueAxis = chart.yAxes .push (new am4charts.ValueAxis ());
let series = chart.series .push (new am4charts.LineSeries ());
series.tooltipText = "{date}\n[bold font-size: 17px]value: {valueY}[/]" ;
series.dataFields .valueY = "value" ;
series.dataFields .dateX = "date" ;
series.strokeDasharray = 3 ;
series.strokeWidth = 2
series.strokeOpacity = 0.3 ;
series.strokeDasharray = "3,3"
let bullet = series.bullets .push (new am4charts.CircleBullet ());
bullet.strokeWidth = 2 ;
bullet.stroke = am4core.color ("#fff" );
bullet.setStateOnChildren = true ;
bullet.propertyFields .fillOpacity = "opacity" ;
bullet.propertyFields .strokeOpacity = "opacity" ;
let hoverState = bullet.states .create ("hover" );
hoverState.properties .scale = 1.7 ;
function createTrendLine (data ) {
let trend = chart.series .push (new am4charts.LineSeries ());
trend.dataFields .valueY = "value" ;
trend.dataFields .dateX = "date" ;
trend.strokeWidth = 2
trend.stroke = trend.fill = am4core.color ("#c00" );
trend.data = data;
let bullet = trend.bullets .push (new am4charts.CircleBullet ());
bullet.tooltipText = "{date}\n[bold font-size: 17px]value: {valueY}[/]" ;
bullet.strokeWidth = 2 ;
bullet.stroke = am4core.color ("#fff" )
bullet.circle .fill = trend.stroke ;
let hoverState = bullet.states .create ("hover" );
hoverState.properties .scale = 1.7 ;
return trend;
};
createTrendLine ([
{ "date" : "2012-01-02" , "value" : 10 },
{ "date" : "2012-01-11" , "value" : 19 }
]);
let lastTrend = createTrendLine ([
{ "date" : "2012-01-17" , "value" : 16 },
{ "date" : "2012-01-22" , "value" : 10 }
]);
lastTrend.events .once ("datavalidated" , function (xAxis .zoomToDates (new Date (2012 , 0 , 2 ), new Date (2012 , 0 , 13 ));
});