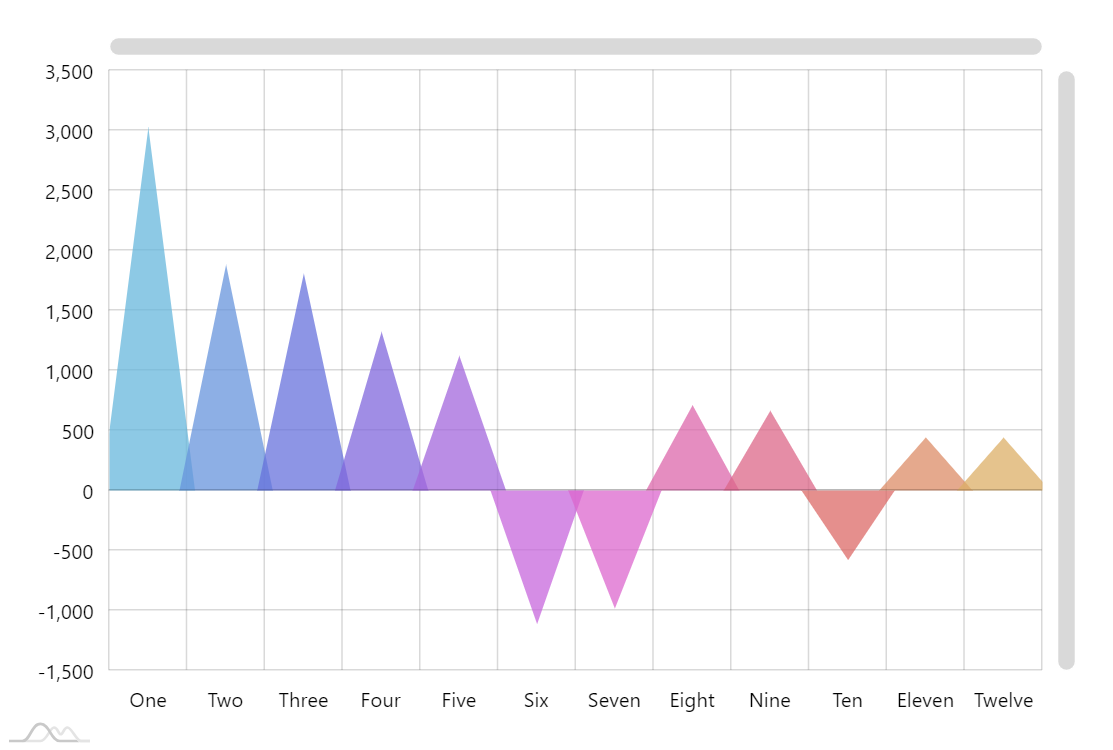
Triangle column chart
This is a variation of a regular column chart where triangles are used instead of rectangles. Technically this is the same as curved-columns chart with tension of curved column set to 1.
Demo source
<!-- Styles -->
<style>
#chartdiv {
  width: 100%;
  height: 500px;
}

</style>

<!-- Resources -->
<script src="https://cdn.amcharts.com/lib/4/core.js"></script>
<script src="https://cdn.amcharts.com/lib/4/charts.js"></script>
<script src="https://cdn.amcharts.com/lib/4/themes/animated.js"></script>

<!-- Chart code -->
<script>
am4core.ready(function() {

// Themes begin
am4core.useTheme(am4themes_animated);
// Themes end

var chart = am4core.create("chartdiv", am4charts.XYChart);
chart.hiddenState.properties.opacity = 0; // this makes initial fade in effect

chart.data = [{
  "country": "One",
  "value": 3025
}, {
  "country": "Two",
  "value": 1882
}, {
  "country": "Three",
  "value": 1809
}, {
  "country": "Four",
  "value": 1322
}, {
  "country": "Five",
  "value": 1122
}, {
  "country": "Six",
  "value": -1114
}, {
  "country": "Seven",
  "value": -984
}, {
  "country": "Eight",
  "value": 711
}, {
  "country": "Nine",
  "value": 665
}, {
  "country": "Ten",
  "value": -580
}, {
  "country": "Eleven",
  "value": 443
}, {
  "country": "Twelve",
  "value": 441
}];


var categoryAxis = chart.xAxes.push(new am4charts.CategoryAxis());
categoryAxis.renderer.grid.template.location = 0;
categoryAxis.dataFields.category = "country";
categoryAxis.renderer.minGridDistance = 40;

var valueAxis = chart.yAxes.push(new am4charts.ValueAxis());

var series = chart.series.push(new am4charts.CurvedColumnSeries());
series.dataFields.categoryX = "country";
series.dataFields.valueY = "value";
series.tooltipText = "{valueY.value}"
series.columns.template.strokeOpacity = 0;
series.columns.template.tension = 1;

series.columns.template.fillOpacity = 0.75;

var hoverState = series.columns.template.states.create("hover");
hoverState.properties.fillOpacity = 1;
hoverState.properties.tension = 0.8;

chart.cursor = new am4charts.XYCursor();

// Add distinctive colors for each column using adapter
series.columns.template.adapter.add("fill", function(fill, target) {
  return chart.colors.getIndex(target.dataItem.index);
});

chart.scrollbarX = new am4core.Scrollbar();
chart.scrollbarY = new am4core.Scrollbar();

}); // end am4core.ready()
</script>

<!-- HTML -->
<div id="chartdiv"></div>