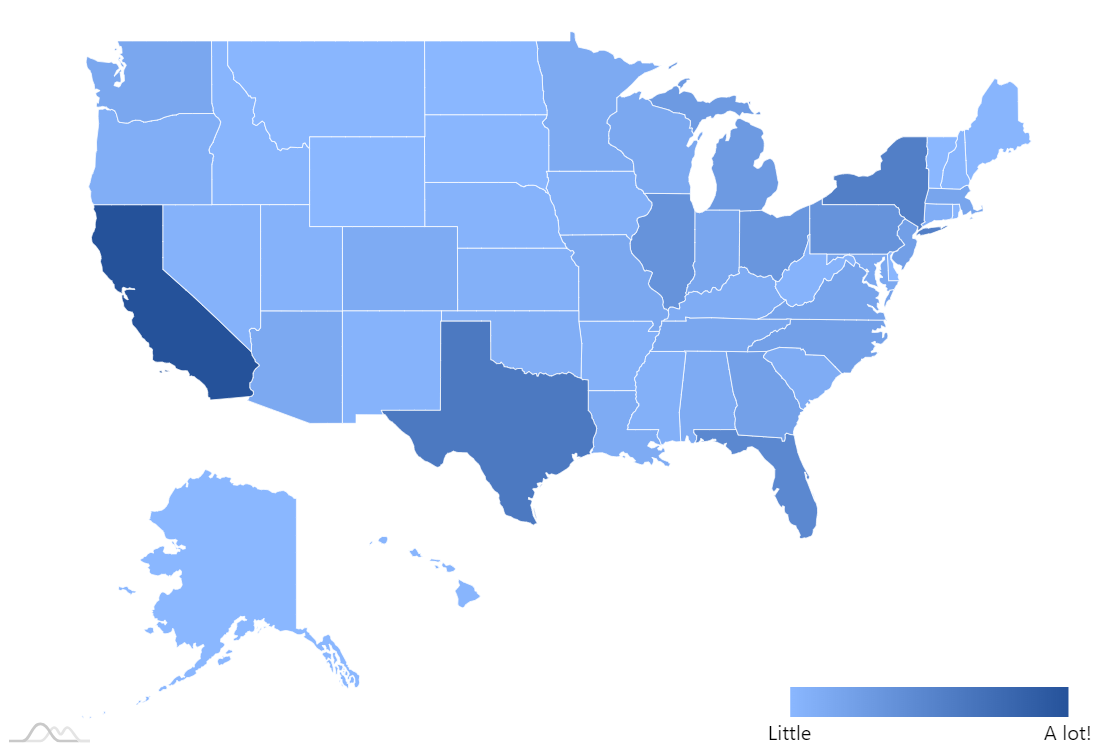
US heat (choropleth) map
Using our mapping tool you can easily create heat (or as BI-centric folks like to call it, choropleth) maps. You only need to set light and dark color, and if your areas/countries/states has value assigned, the map will automatically choose intermediate color corresponding its value.
Demo source
<!-- Styles -->
<style>
#chartdiv {
  width: 100%;
  height: 500px
}

</style>

<!-- Resources -->
<script src="https://cdn.amcharts.com/lib/4/core.js"></script>
<script src="https://cdn.amcharts.com/lib/4/maps.js"></script>
<script src="https://cdn.amcharts.com/lib/4/geodata/usaLow.js"></script>
<script src="https://cdn.amcharts.com/lib/4/themes/animated.js"></script>

<!-- Chart code -->
<script>
am4core.ready(function() {

// Themes begin
am4core.useTheme(am4themes_animated);
// Themes end

 // Create map instance
var chart = am4core.create("chartdiv", am4maps.MapChart);

// Set map definition
chart.geodata = am4geodata_usaLow;

// Set projection
chart.projection = new am4maps.projections.AlbersUsa();

// Create map polygon series
var polygonSeries = chart.series.push(new am4maps.MapPolygonSeries());

//Set min/max fill color for each area
polygonSeries.heatRules.push({
  property: "fill",
  target: polygonSeries.mapPolygons.template,
  min: chart.colors.getIndex(1).brighten(1),
  max: chart.colors.getIndex(1).brighten(-0.3)
});

// Make map load polygon data (state shapes and names) from GeoJSON
polygonSeries.useGeodata = true;

// Set heatmap values for each state
polygonSeries.data = [
  {
    id: "US-AL",
    value: 4447100
  },
  {
    id: "US-AK",
    value: 626932
  },
  {
    id: "US-AZ",
    value: 5130632
  },
  {
    id: "US-AR",
    value: 2673400
  },
  {
    id: "US-CA",
    value: 33871648
  },
  {
    id: "US-CO",
    value: 4301261
  },
  {
    id: "US-CT",
    value: 3405565
  },
  {
    id: "US-DE",
    value: 783600
  },
  {
    id: "US-FL",
    value: 15982378
  },
  {
    id: "US-GA",
    value: 8186453
  },
  {
    id: "US-HI",
    value: 1211537
  },
  {
    id: "US-ID",
    value: 1293953
  },
  {
    id: "US-IL",
    value: 12419293
  },
  {
    id: "US-IN",
    value: 6080485
  },
  {
    id: "US-IA",
    value: 2926324
  },
  {
    id: "US-KS",
    value: 2688418
  },
  {
    id: "US-KY",
    value: 4041769
  },
  {
    id: "US-LA",
    value: 4468976
  },
  {
    id: "US-ME",
    value: 1274923
  },
  {
    id: "US-MD",
    value: 5296486
  },
  {
    id: "US-MA",
    value: 6349097
  },
  {
    id: "US-MI",
    value: 9938444
  },
  {
    id: "US-MN",
    value: 4919479
  },
  {
    id: "US-MS",
    value: 2844658
  },
  {
    id: "US-MO",
    value: 5595211
  },
  {
    id: "US-MT",
    value: 902195
  },
  {
    id: "US-NE",
    value: 1711263
  },
  {
    id: "US-NV",
    value: 1998257
  },
  {
    id: "US-NH",
    value: 1235786
  },
  {
    id: "US-NJ",
    value: 8414350
  },
  {
    id: "US-NM",
    value: 1819046
  },
  {
    id: "US-NY",
    value: 18976457
  },
  {
    id: "US-NC",
    value: 8049313
  },
  {
    id: "US-ND",
    value: 642200
  },
  {
    id: "US-OH",
    value: 11353140
  },
  {
    id: "US-OK",
    value: 3450654
  },
  {
    id: "US-OR",
    value: 3421399
  },
  {
    id: "US-PA",
    value: 12281054
  },
  {
    id: "US-RI",
    value: 1048319
  },
  {
    id: "US-SC",
    value: 4012012
  },
  {
    id: "US-SD",
    value: 754844
  },
  {
    id: "US-TN",
    value: 5689283
  },
  {
    id: "US-TX",
    value: 20851820
  },
  {
    id: "US-UT",
    value: 2233169
  },
  {
    id: "US-VT",
    value: 608827
  },
  {
    id: "US-VA",
    value: 7078515
  },
  {
    id: "US-WA",
    value: 5894121
  },
  {
    id: "US-WV",
    value: 1808344
  },
  {
    id: "US-WI",
    value: 5363675
  },
  {
    id: "US-WY",
    value: 493782
  }
];

// Set up heat legend
let heatLegend = chart.createChild(am4maps.HeatLegend);
heatLegend.series = polygonSeries;
heatLegend.align = "right";
heatLegend.valign = "bottom";
heatLegend.width = am4core.percent(20);
heatLegend.marginRight = am4core.percent(4);
heatLegend.minValue = 0;
heatLegend.maxValue = 40000000;

// Set up custom heat map legend labels using axis ranges
var minRange = heatLegend.valueAxis.axisRanges.create();
minRange.value = heatLegend.minValue;
minRange.label.text = "Little";
var maxRange = heatLegend.valueAxis.axisRanges.create();
maxRange.value = heatLegend.maxValue;
maxRange.label.text = "A lot!";

// Blank out internal heat legend value axis labels
heatLegend.valueAxis.renderer.labels.template.adapter.add("text", function(labelText) {
  return "";
});

// Configure series tooltip
var polygonTemplate = polygonSeries.mapPolygons.template;
polygonTemplate.tooltipText = "{name}: {value}";
polygonTemplate.nonScalingStroke = true;
polygonTemplate.strokeWidth = 0.5;

// Create hover state and set alternative fill color
var hs = polygonTemplate.states.create("hover");
hs.properties.fill = am4core.color("#3c5bdc");

}); // end am4core.ready()
</script>

<!-- HTML -->
<div id="chartdiv"></div>