Weather map
Composite map markers
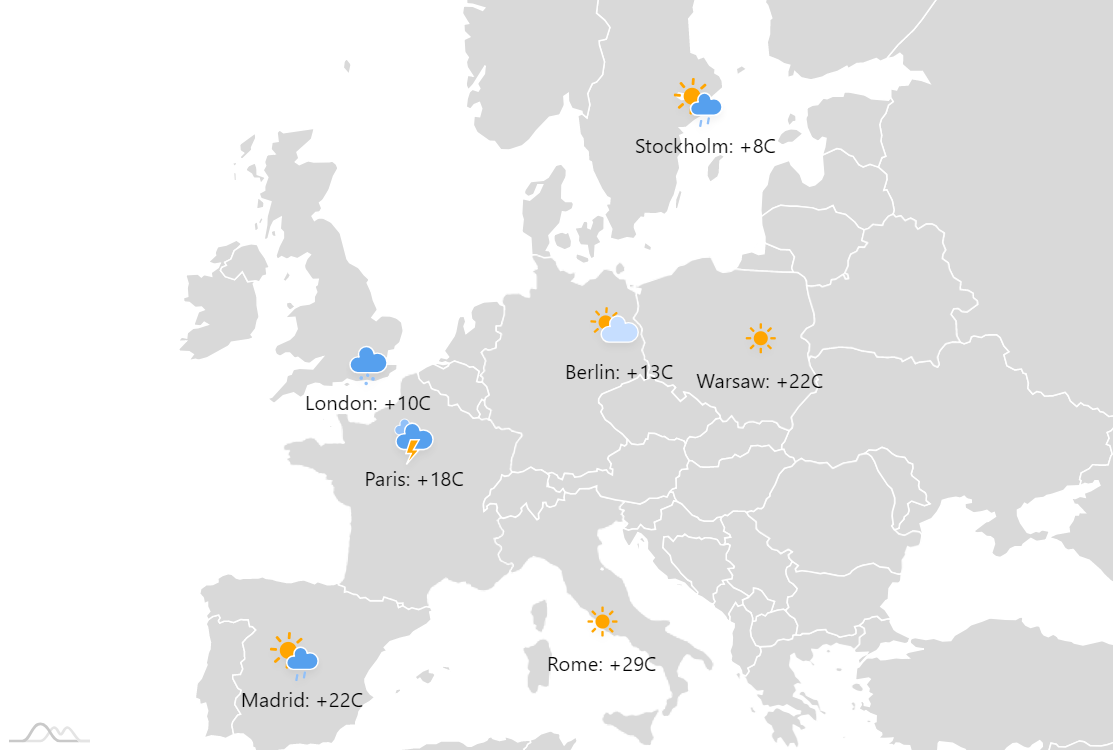
This demo showcases how you can combine several elements into a single map marker. In this case we combine an animated SVG image and a text label.
They are placed at certain coordinates and therefore move with map.
Demo source
<!-- Styles -->
<style>
#chartdiv {
  width: 100%;
  height: 500px;
}
</style>

<!-- Resources -->
<script src="https://cdn.amcharts.com/lib/4/core.js"></script>
<script src="https://cdn.amcharts.com/lib/4/maps.js"></script>
<script src="https://cdn.amcharts.com/lib/4/geodata/worldHigh.js"></script>
<script src="https://cdn.amcharts.com/lib/4/themes/animated.js"></script>

<!-- Chart code -->
<script>
am4core.ready(function() {

// Themes begin
am4core.useTheme(am4themes_animated);
// Themes end

// Create map instance
var chart = am4core.create("chartdiv", am4maps.MapChart);

// Set map definition
chart.geodata = am4geodata_worldHigh;

// Set projection
chart.projection = new am4maps.projections.Mercator();

// Center on the groups by default
chart.homeZoomLevel = 6;
chart.homeGeoPoint = { longitude: 10, latitude: 51 };

// Polygon series
var polygonSeries = chart.series.push(new am4maps.MapPolygonSeries());
polygonSeries.exclude = ["AQ"];
polygonSeries.useGeodata = true;
polygonSeries.nonScalingStroke = true;
polygonSeries.strokeOpacity = 0.5;

// Image series
var imageSeries = chart.series.push(new am4maps.MapImageSeries());
var imageTemplate = imageSeries.mapImages.template;
imageTemplate.propertyFields.longitude = "longitude";
imageTemplate.propertyFields.latitude = "latitude";
imageTemplate.nonScaling = true;

var image = imageTemplate.createChild(am4core.Image);
image.propertyFields.href = "imageURL";
image.width = 50;
image.height = 50;
image.horizontalCenter = "middle";
image.verticalCenter = "middle";

var label = imageTemplate.createChild(am4core.Label);
label.text = "{label}";
label.horizontalCenter = "middle";
label.verticalCenter = "top";
label.dy = 20;

imageSeries.data = [{
  "latitude": 40.416775,
  "longitude": -3.703790,
  "imageURL": "https://www.amcharts.com/lib/images/weather/animated/rainy-1.svg",
  "width": 32,
  "height": 32,
  "label": "Madrid: +22C"
}, {
  "latitude": 48.856614,
  "longitude": 2.352222,
  "imageURL": "https://www.amcharts.com/lib/images/weather/animated/thunder.svg",
  "width": 32,
  "height": 32,
  "label": "Paris: +18C"
}, {
  "latitude": 52.520007,
  "longitude": 13.404954,
  "imageURL": "https://www.amcharts.com/lib/images/weather/animated/cloudy-day-1.svg",
  "width": 32,
  "height": 32,
  "label": "Berlin: +13C"
}, {
  "latitude": 52.229676,
  "longitude": 21.012229,
  "imageURL": "https://www.amcharts.com/lib/images/weather/animated/day.svg",
  "width": 32,
  "height": 32,
  "label": "Warsaw: +22C"
}, {
  "latitude": 41.872389,
  "longitude": 12.480180,
  "imageURL": "https://www.amcharts.com/lib/images/weather/animated/day.svg",
  "width": 32,
  "height": 32,
  "label": "Rome: +29C"
}, {
  "latitude": 51.507351,
  "longitude": -0.127758,
  "imageURL": "https://www.amcharts.com/lib/images/weather/animated/rainy-7.svg",
  "width": 32,
  "height": 32,
  "label": "London: +10C"
}, {
  "latitude": 59.329323,
  "longitude": 18.068581,
  "imageURL": "https://www.amcharts.com/lib/images/weather/animated/rainy-1.svg",
  "width": 32,
  "height": 32,
  "label": "Stockholm: +8C"
} ];

}); // end am4core.ready()
</script>

<!-- HTML -->
<div id="chartdiv"></div>