JavaScript TypeScript / ES6 ...
<style >
#chartdiv {
width : 100% ;
height : 500px ;
}
</style >
<script src ="https://cdn.amcharts.com/lib/4/core.js" > </script >
<script src ="https://cdn.amcharts.com/lib/4/charts.js" > </script >
<script src ="https://cdn.amcharts.com/lib/4/themes/animated.js" > </script >
<script >
am4core.ready (function (useTheme (am4themes_animated);
var chart = am4core.create ("chartdiv" , am4charts.XYChart );
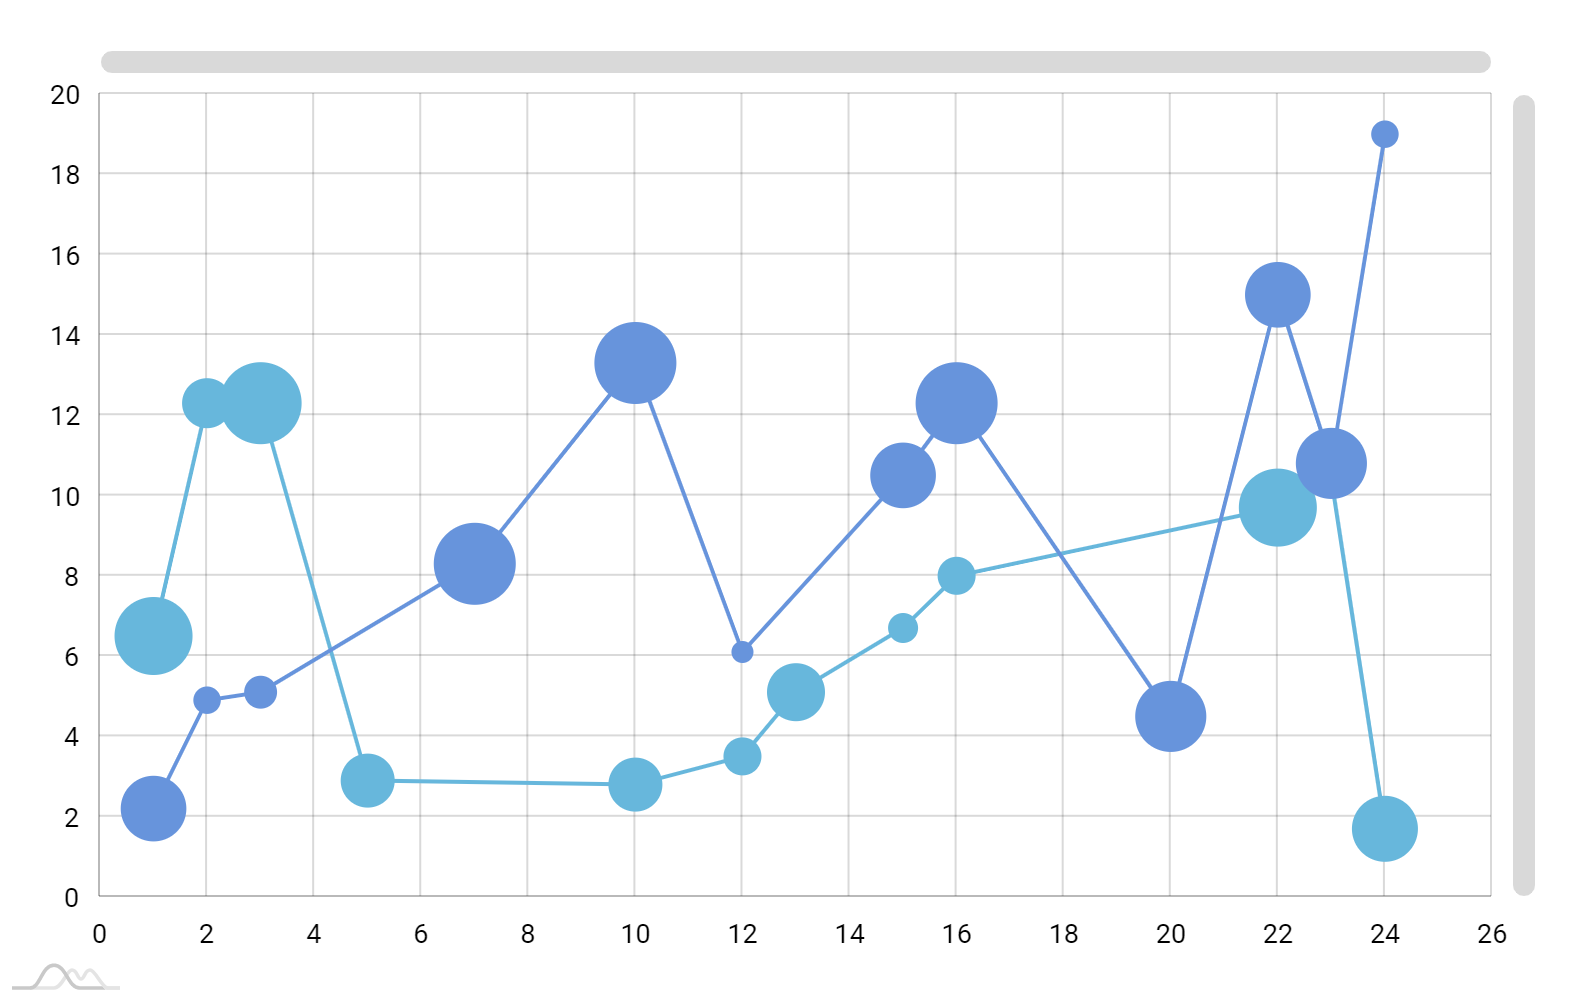
chart.data = [{
"x" : 1 ,
"ay" : 6.5 ,
"by" : 2.2 ,
"aValue" : 15 ,
"bValue" : 10
}, {
"x" : 2 ,
"ay" : 12.3 ,
"by" : 4.9 ,
"aValue" : 8 ,
"bValue" : 3
}, {
"x" : 3 ,
"ay" : 12.3 ,
"by" : 5.1 ,
"aValue" : 16 ,
"bValue" : 4
}, {
"x" : 5 ,
"ay" : 2.9 ,
"aValue" : 9
}, {
"x" : 7 ,
"by" : 8.3 ,
"bValue" : 13
}, {
"x" : 10 ,
"ay" : 2.8 ,
"by" : 13.3 ,
"aValue" : 9 ,
"bValue" : 13
}, {
"x" : 12 ,
"ay" : 3.5 ,
"by" : 6.1 ,
"aValue" : 5 ,
"bValue" : 2
}, {
"x" : 13 ,
"ay" : 5.1 ,
"aValue" : 10
}, {
"x" : 15 ,
"ay" : 6.7 ,
"by" : 10.5 ,
"aValue" : 3 ,
"bValue" : 10
}, {
"x" : 16 ,
"ay" : 8 ,
"by" : 12.3 ,
"aValue" : 5 ,
"bValue" : 13
}, {
"x" : 20 ,
"by" : 4.5 ,
"bValue" : 11
}, {
"x" : 22 ,
"ay" : 9.7 ,
"by" : 15 ,
"aValue" : 15 ,
"bValue" : 10
}, {
"x" : 23 ,
"ay" : 10.4 ,
"by" : 10.8 ,
"aValue" : 1 ,
"bValue" : 11
}, {
"x" : 24 ,
"ay" : 1.7 ,
"by" : 19 ,
"aValue" : 12 ,
"bValue" : 3
}];
var xAxis = chart.xAxes .push (new am4charts.ValueAxis ());
xAxis.renderer .minGridDistance = 40 ;
var yAxis = chart.yAxes .push (new am4charts.ValueAxis ());
var series1 = chart.series .push (new am4charts.LineSeries ());
series1.dataFields .valueX = "x" ;
series1.dataFields .valueY = "ay" ;
series1.dataFields .value = "aValue" ;
series1.strokeWidth = 2 ;
var bullet1 = series1.bullets .push (new am4charts.CircleBullet ());
series1.heatRules .push ({
target : bullet1.circle ,
min : 5 ,
max : 20 ,
property : "radius"
});
bullet1.tooltipText = "{valueX} x {valueY}: [bold]{value}[/]" ;
var series2 = chart.series .push (new am4charts.LineSeries ());
series2.dataFields .valueX = "x" ;
series2.dataFields .valueY = "by" ;
series2.dataFields .value = "bValue" ;
series2.strokeWidth = 2 ;
var bullet2 = series2.bullets .push (new am4charts.CircleBullet ());
series2.heatRules .push ({
target : bullet2.circle ,
min : 5 ,
max : 20 ,
property : "radius"
});
bullet2.tooltipText = "{valueX} x {valueY}: [bold]{value}[/]" ;
chart.scrollbarX = new am4core.Scrollbar ();
chart.scrollbarY = new am4core.Scrollbar ();
});
</script >
<div id ="chartdiv" > </div >
import * as am4core from "@amcharts/amcharts4/core" ;
import * as am4charts from "@amcharts/amcharts4/charts" ;
import am4themes_animated from "@amcharts/amcharts4/themes/animated" ;
am4core.useTheme (am4themes_animated);
let chart = am4core.create ("chartdiv" , am4charts.XYChart );
chart.data = [{
"x" : 1 ,
"ay" : 6.5 ,
"by" : 2.2 ,
"aValue" : 15 ,
"bValue" : 10
}, {
"x" : 2 ,
"ay" : 12.3 ,
"by" : 4.9 ,
"aValue" : 8 ,
"bValue" : 3
}, {
"x" : 3 ,
"ay" : 12.3 ,
"by" : 5.1 ,
"aValue" : 16 ,
"bValue" : 4
}, {
"x" : 5 ,
"ay" : 2.9 ,
"aValue" : 9
}, {
"x" : 7 ,
"by" : 8.3 ,
"bValue" : 13
}, {
"x" : 10 ,
"ay" : 2.8 ,
"by" : 13.3 ,
"aValue" : 9 ,
"bValue" : 13
}, {
"x" : 12 ,
"ay" : 3.5 ,
"by" : 6.1 ,
"aValue" : 5 ,
"bValue" : 2
}, {
"x" : 13 ,
"ay" : 5.1 ,
"aValue" : 10
}, {
"x" : 15 ,
"ay" : 6.7 ,
"by" : 10.5 ,
"aValue" : 3 ,
"bValue" : 10
}, {
"x" : 16 ,
"ay" : 8 ,
"by" : 12.3 ,
"aValue" : 5 ,
"bValue" : 13
}, {
"x" : 20 ,
"by" : 4.5 ,
"bValue" : 11
}, {
"x" : 22 ,
"ay" : 9.7 ,
"by" : 15 ,
"aValue" : 15 ,
"bValue" : 10
}, {
"x" : 23 ,
"ay" : 10.4 ,
"by" : 10.8 ,
"aValue" : 1 ,
"bValue" : 11
}, {
"x" : 24 ,
"ay" : 1.7 ,
"by" : 19 ,
"aValue" : 12 ,
"bValue" : 3
}];
let xAxis = chart.xAxes .push (new am4charts.ValueAxis ());
xAxis.renderer .minGridDistance = 40 ;
let yAxis = chart.yAxes .push (new am4charts.ValueAxis ());
let series1 = chart.series .push (new am4charts.LineSeries ());
series1.dataFields .valueX = "x" ;
series1.dataFields .valueY = "ay" ;
series1.dataFields .value = "aValue" ;
series1.strokeWidth = 2 ;
let bullet1 = series1.bullets .push (new am4charts.CircleBullet ());
series1.heatRules .push ({
target : bullet1.circle ,
min : 5 ,
max : 20 ,
property : "radius"
});
bullet1.tooltipText = "{valueX} x {valueY}: [bold]{value}[/]" ;
let series2 = chart.series .push (new am4charts.LineSeries ());
series2.dataFields .valueX = "x" ;
series2.dataFields .valueY = "by" ;
series2.dataFields .value = "bValue" ;
series2.strokeWidth = 2 ;
let bullet2 = series2.bullets .push (new am4charts.CircleBullet ());
series2.heatRules .push ({
target : bullet2.circle ,
min : 5 ,
max : 20 ,
property : "radius"
});
bullet2.tooltipText = "{valueX} x {valueY}: [bold]{value}[/]" ;
chart.scrollbarX = new am4core.Scrollbar ();
chart.scrollbarY = new am4core.Scrollbar ();